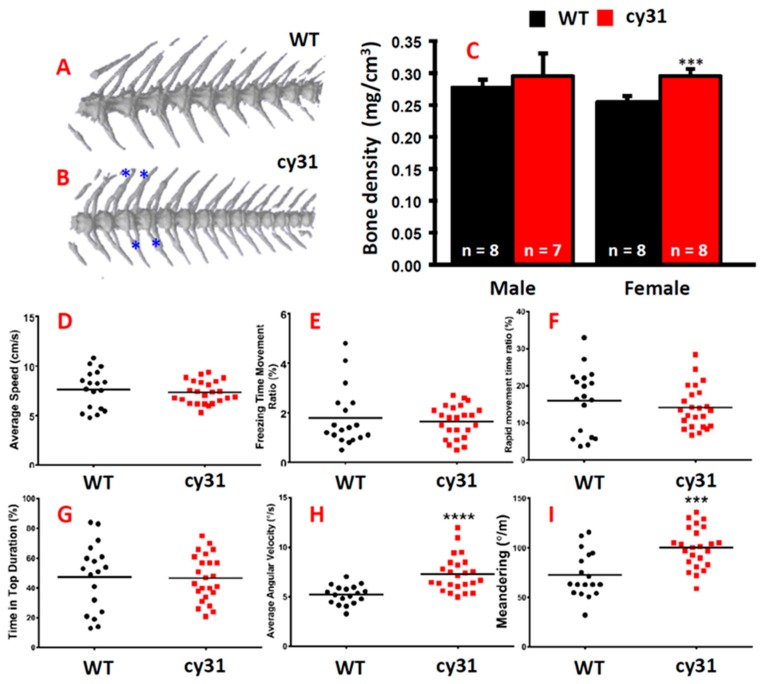
Figure 6.
Computed tomography of both genders in wild type and Tg(Ola.Sp7:N1aICD)cy31 fish. (A,B) Three dimensional computed tomography for female WT, female Tg(Ola.Sp7:N1aICD)cy31, male WT, and male Tg(Ola.Sp7:N1aICD)cy31 fish. Three-dimensional computed tomography of spinal bone for WT and Tg(Ola.Sp7:N1aICD)cy31 fish. The blue * indicated the region where the knots occured (n = fish number). (C) Bone density of WT and N1aICD-overexpressing transgenic fish in both genders. (D–I) Comparison of three-dimensional locomotion swimming patterns between WT and Tg(Ola.Sp7:N1aICD)cy31 transgenic fish which are based on endpoints of average speed (D), freezing time movement ratio (E), rapid movement time ratio (F), time in tope duration (G), average angular velocity (H), and meandering (I). Significance was tested by Student’s t-test and data were presented as averages ± SD (*** p < 0.005, **** p < 0.001). Black circles and red squares represent the data for wild type and Tg(Ola.Sp7:N1aICD)cy31 fish, respectively.

