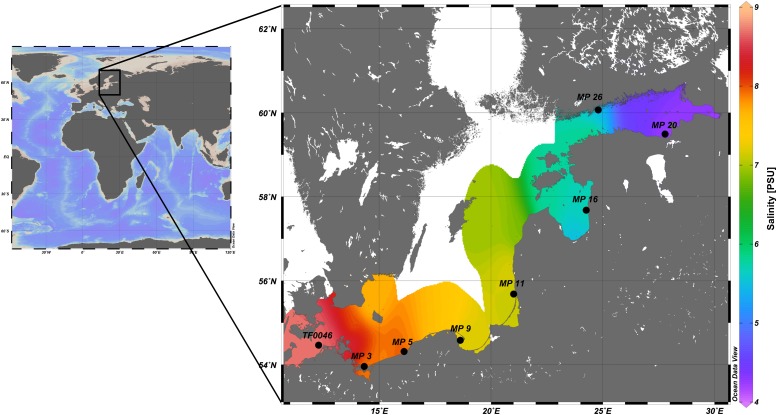
FIGURE 1.
Map of the study location of the Baltic Sea and of the sampling stations included in the incubation experiments along the Baltic Sea coast (enlarged). Salinities in the surface water are those measured during cruise POS488 (some stations are not depicted) and subsequently extrapolated. The map was created using Ocean Data View v. 5.0 (Schlitzer, 2018).

