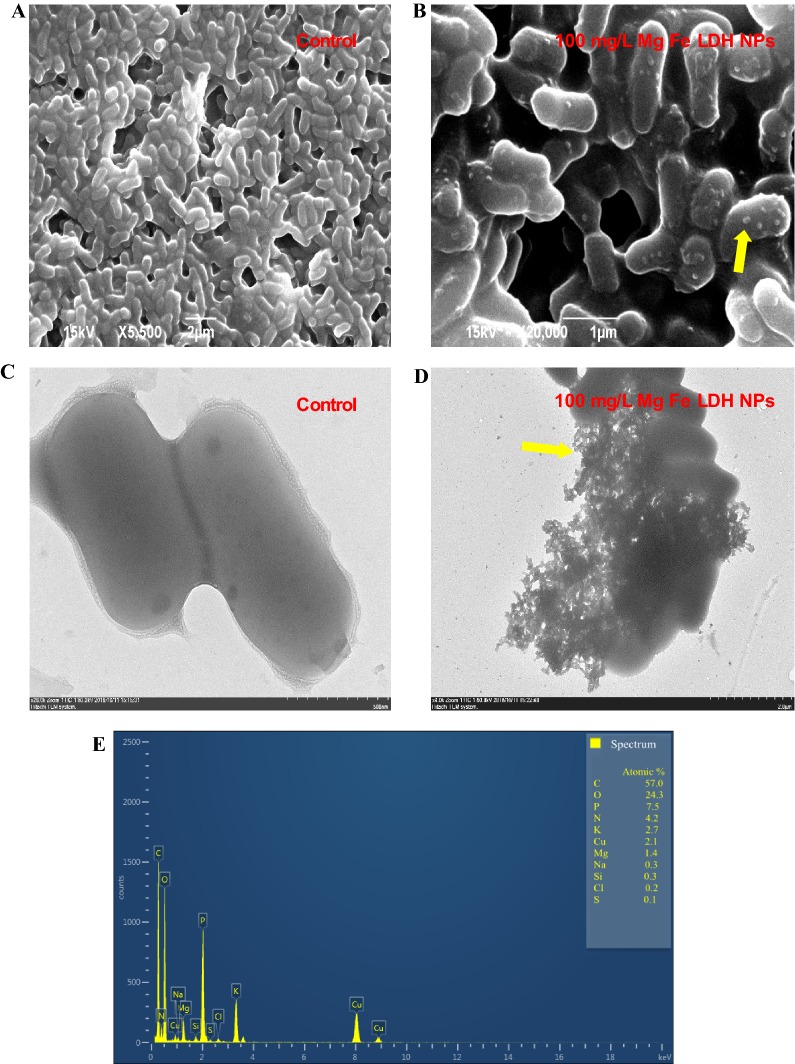
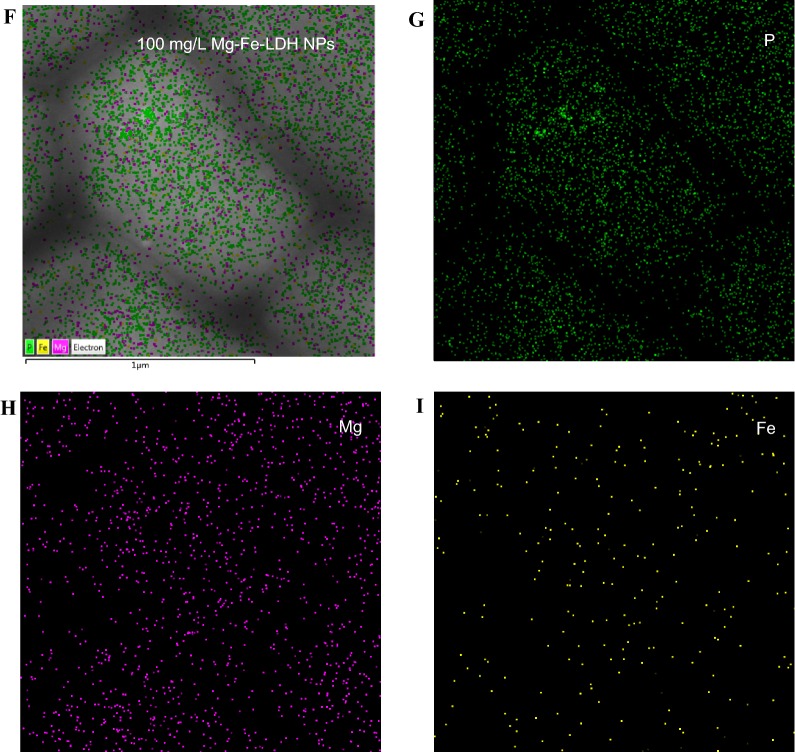
Fig. 3.
Characterization of A. oxidans KQ11 cell structure after exposure to 100 mg/L of Mg–Fe-LDH NPs for 30 h using SEM (A, B), TEM (C, D), EDS (E), and EDS mapping (D–I). The yellow arrows show Mg–Fe-LDH NPs attached to cell surfaces (for interpretation of the color references to color in this figure legend, the reader is referred to the web version of this article)


