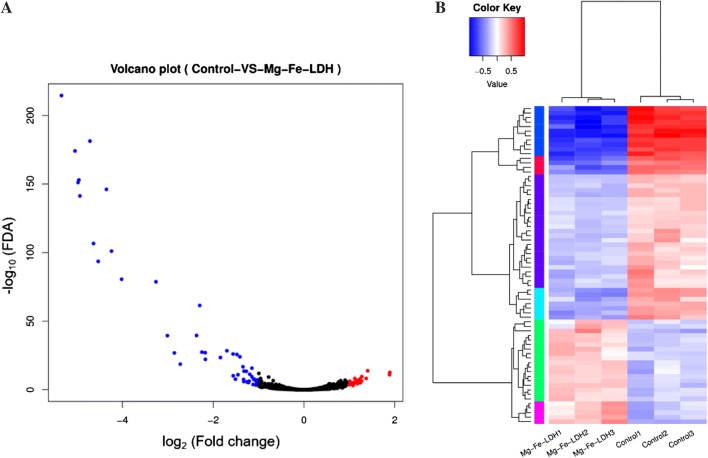
Fig. 5.
Changes in the gene expression of A. oxidans KQ11 cells induced by Mg–Fe-LDH treatment. A Significantly up-regulated genes are shown in red, down-regulated genes in blue, and those not exhibiting significant differences in expression are shown as black dots. The abscissa represents the fold changes in gene expression among different samples, and the ordinate represents the statistical significance of differences in expression change. B Heat map and clustering analysis of transcriptional profiles of genes encoding transcription factors. High expression levels are depicted in red, and low expression levels in blue. Clustering was conducted using log10 (FPKM + 1) values after normalization of expression values

