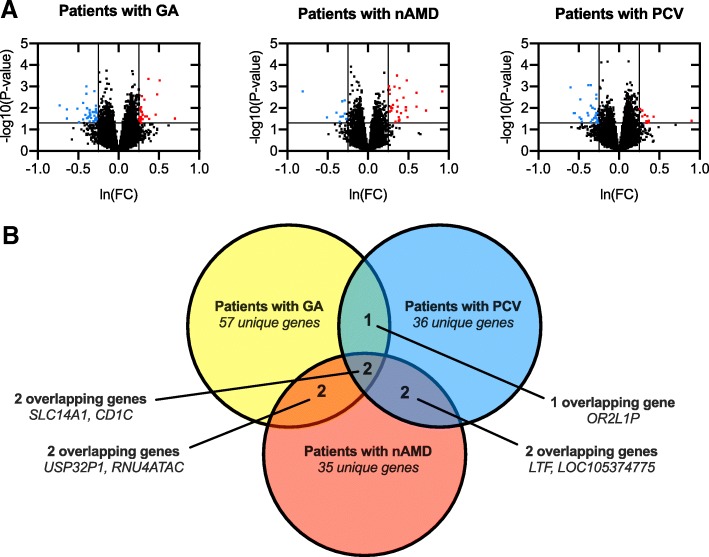
Fig. 1.
Volcano plots of all quantified genes in the transcriptome analysis of peripheral blood mononuclear cells (PBMCs) and Venn diagram to illustrate similarities and differences. a Volcano plots the PBMC transcriptome for each of the different clinical subtype of late AMD when compared to the healthy controls. Significantly differentially expressed genes are defined as those with at least ±30% change (level of magnitude, vertical lines) and P < 0.05 (level of statistical significance, horizontal line) and illustrated in red (increased expression) or blue (decreased expression). P-values are obtained using analysis of covariance including run date, age, and sex as co-variates and with patients versus healthy controls as contrast. P-values are logarithmic transformed for plot construction. b Venn diagram illustrates the small overlap of differentially expressed genes across the different clinical subtypes

