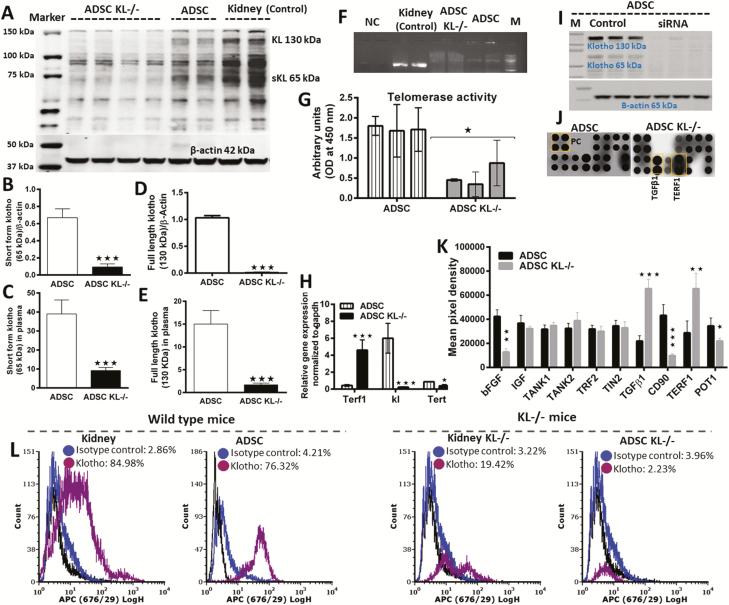
Figure 2.
Comparative klotho expression and protein profile of adipose-derived stem cells (ADSC) with or without klotho knockdown with siRNA. (A) Western blot showing full-length klotho (130 kDa) and short form klotho protein (65 kDa). (B,C) Comparative expression of short form klotho in ADSC and in plasma of KL-/- and wild-type mice. (D,E) Comparative expression of full-length klotho in ADSC and in plasma of KL-/- and wild-type mice. (F) PCR confirmation for klotho siRNA knockdown. (G) Telomerase activity in ADSC, and in klotho knockdown ADSC with siRNA. (H) Gene level confirmation of klotho siRNA knockdown and its effects on Terf1 and Tert expression. (I) Western blot confirming klotho siRNA knockdown. (J,K) Protein profile of telomerase activity in ADSC and siRNA knockdown ADSC for klotho. (L) Kidney and ADSC showing protein expression of KL measured by flow cytometry in wild-type mice and KL-/- mice. Mean ± SEM, statistically significant values are: *p = .05; **p = .01; ***p = .001.

