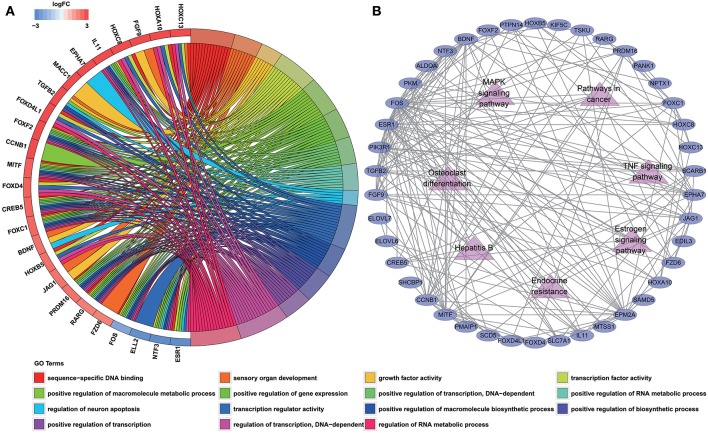
Figure 3.
Functional enrichment analysis of 60 DEmRNAs. (A) Chord diagram showing enriched GO clusters for the 60 DEmRNAs. In each chord diagram, genes contributing to their respective enrichment are shown on the left, and enriched GO clusters are shown on the right. Downregulated DEmRNAs are displayed in blue, whereas upregulated DEmRNAs are displayed in red. Each GO term is represented by one colored line. (B) PPI networks of the DEmRNAs. Ellipse represents DEmRNA, and edge represents the interaction between two proteins. Triangles represent pathways in which 60 DEmRNAs were enriched.

