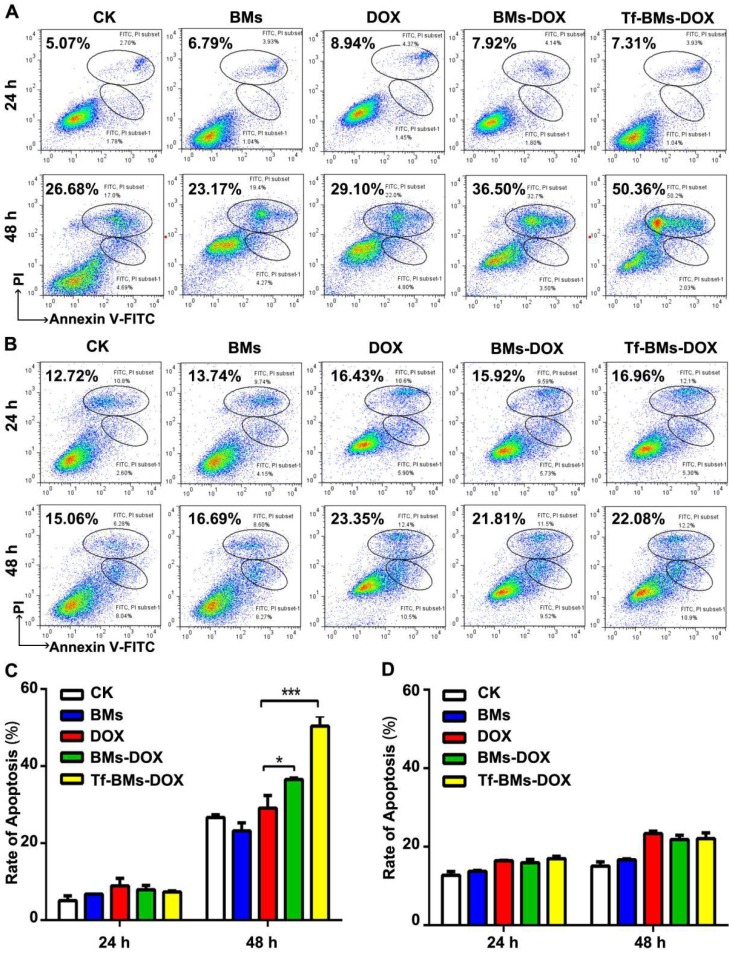
Figure 7.
Apoptosis analysis of HepG2 and HL-7702 cells in vitro. (A) Flow cytometric analysis of Annexin V/PI double staining of HepG2 cells after the treatment for 24 h and 48 h. (B) Flow cytometric analysis of Annexin V/PI double staining of HL-7702 cells after the treatment for 24 h and 48 h. (C) The percentage of apoptotic cells of HepG2 cells after the treatment. (D) The percentage of apoptotic cells of HL-7702 cells after the treatment. *p < 0.05; **p < 0.01; ***p < 0.001. Error bar: SD (n = 3).

