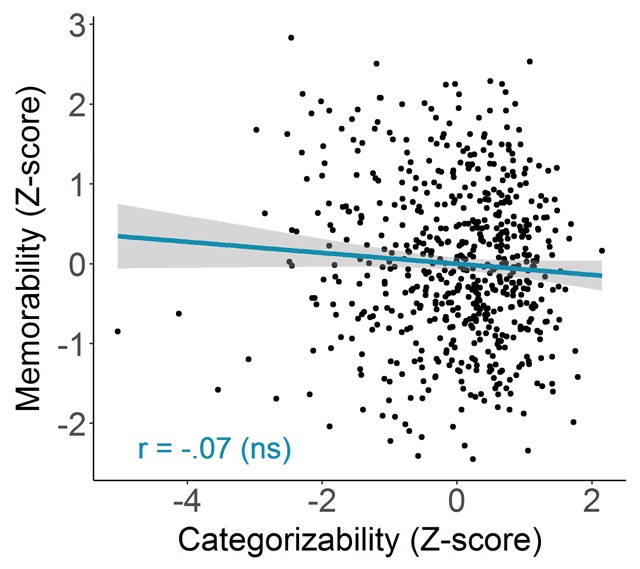
Figure 4.

Memorability in function of categorizability. Each point represents an image (N = 616). The blue line indicates the best fitting regression line and the bands show 95% confidence intervals. The corresponding Pearson correlation is indicated in the bottom left corner.
