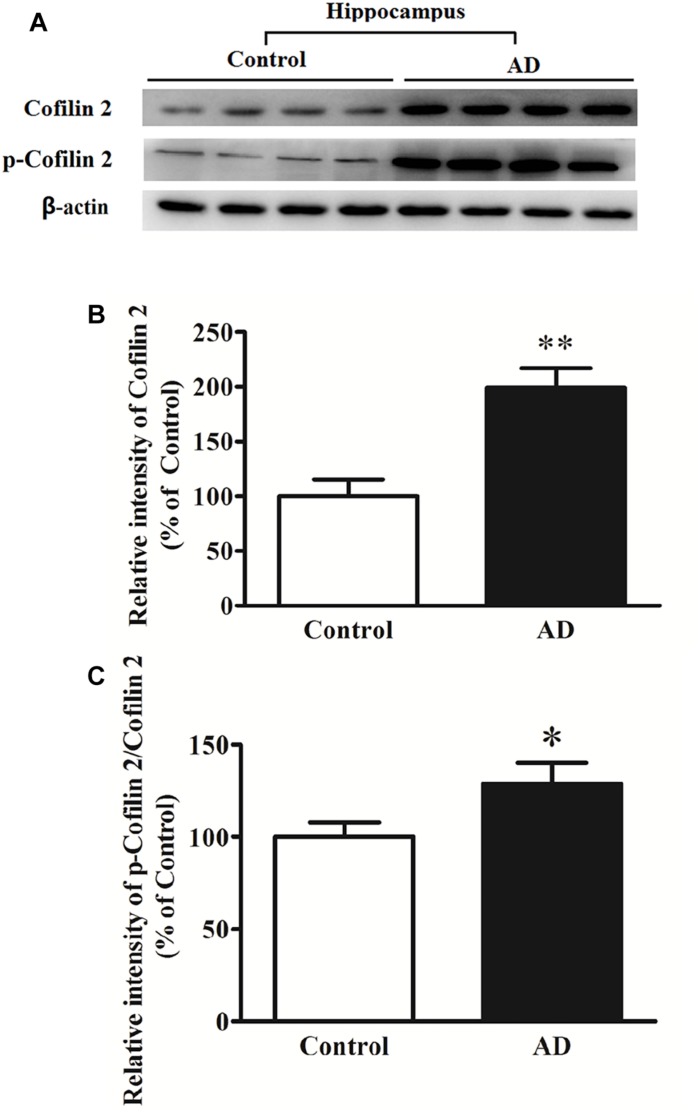
FIGURE 2.
Western blot analysis of cofilin 2 and phospho-cofilin 2 in the hippocampus tissues from AD patients and controls. (A) Representative western blot bands. (B) Quantitative analysis of cofilin 2 expression. (C) Quantitative analysis of cofilin 2 phosphorylation. Quantified results were normalized to β-actin expression. Values were expressed as percentages compared to the controls (set to 100%), and represented as mean ± SEM. n = 10 per group. *p < 0.05, ∗∗p < 0.01 vs. the control group, Student’s t-test.

