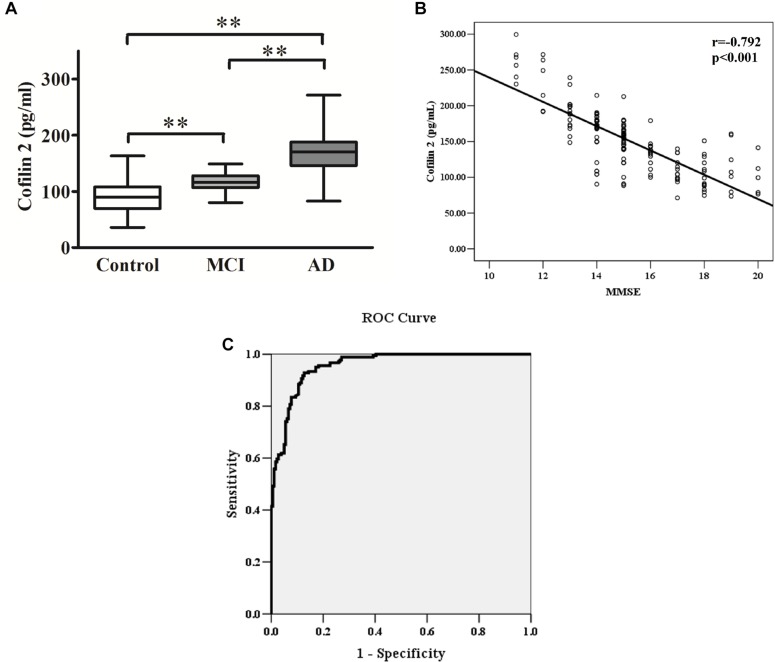
FIGURE 3.
(A) Cofilin 2 levels in serum are presented as box plots for AD (n = 181), MCI (n = 58) and healthy controls (n = 181). The lower and upper sides of the boxes indicate the 25th and 75th percentiles, and the horizontal lines indicate the means. Shown are also the lower and upper whiskers that indicate the minimum and maximum values, respectively. ∗∗p < 0.01 from one way ANOVA with Tukey–Kramer method as a post hoc test. (B) Correlation analysis between cofilin 2 serum levels and MMSE scores in AD patients. Correlation was assessed using the Spearman correlation coefficient. The concentration of serum cofilin 2 is plotted against MMSE scores for each patient. A significant negative correlation between serum cofilin 2 level and MMSE score (r = –0.792, p < 0.001) was observed. Correlation lines are also shown. (C) ROC curve analysis for serum cofilin 2 concentration and the prediction of the presence of AD. The AUC was 0.957. The optimal cut-off value (130.4 pg/ml) was selected. The diagnostic accuracy for cofilin-2 protein levels was 80% with the sensitivity and specificity 93 and 87%, respectively.

