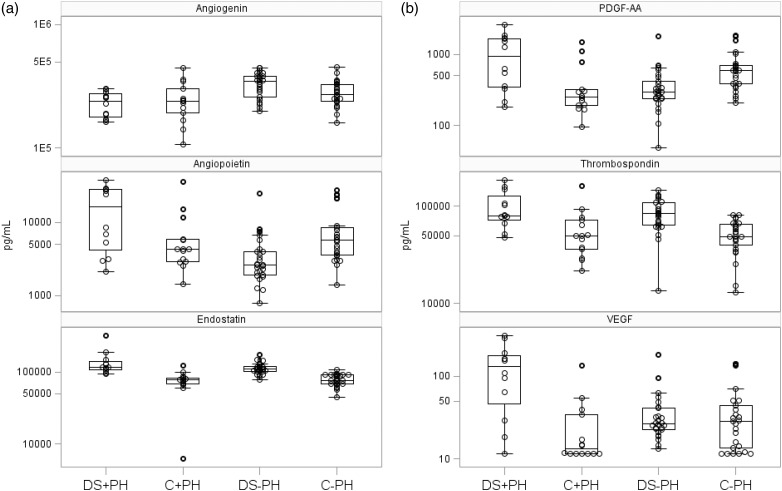
Fig. 1.
(a) Distribution of angiogenic peptide levels in study participants across DS and PH. Median is indicated by a line and the box extends to the 25th and 75th percentiles. Large circles designate means, whiskers extend to values within 1.5 interquartile range, and smaller points are values outside of 1.5 interquartile range. DS: Down syndrome; PDGF: platelet-derived growth factor; PH: pulmonary hypertension; VEGF: vascular endothelial growth factor. (b) Distribution of angiogenic peptide levels in study participants across DS and PH.

