Figure 1.
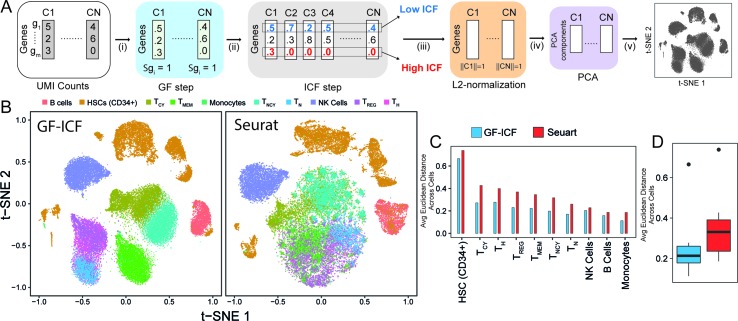
GF-ICF improves visualization of single-cell RNA-sequencing data. (A) The gf-icf pipeline. Starting from transcriptional profiles of a set of cells C1…CN, the pipeline consists of the following steps: (i) normalization of gene expression profiles of each cell to sum one (GF step); (ii) cross-cell normalization, to score rarely expressed genes higher than commonly expressed genes (ICF step); (iii) L2 normalization on each cell to obtain normalized gf-icf weights; and (iv) principal component analysis (PCA) to reduce the number of features (genes) dimensions before (v) projecting cell in an embedded space. (B) Comparison between t-SNE projection following gf-icf pipeline (left) and the Seurat tool (right) on 40k human PBMCs single-cell transcriptional profiles. Cells are colored according to their cell type of origin identified by FACS analysis by Grace et al. (C) Average Euclidean distance among PBMCs of the same type using either gf-icf pipeline or the Seurat tool. (D) Distribution of the average Euclidean distance among PBMCs of the same type using either gf-icf pipeline or the Seurat tool. Legend: TCY, cytotoxic T-cells; TH, helper T-cells; TREG, regulatory T-cells; TMEM, memory T-cells; TNCY, naïve cytotoxic T-cells; TN, naïve T-cells; NK cells, natural killer cells.

