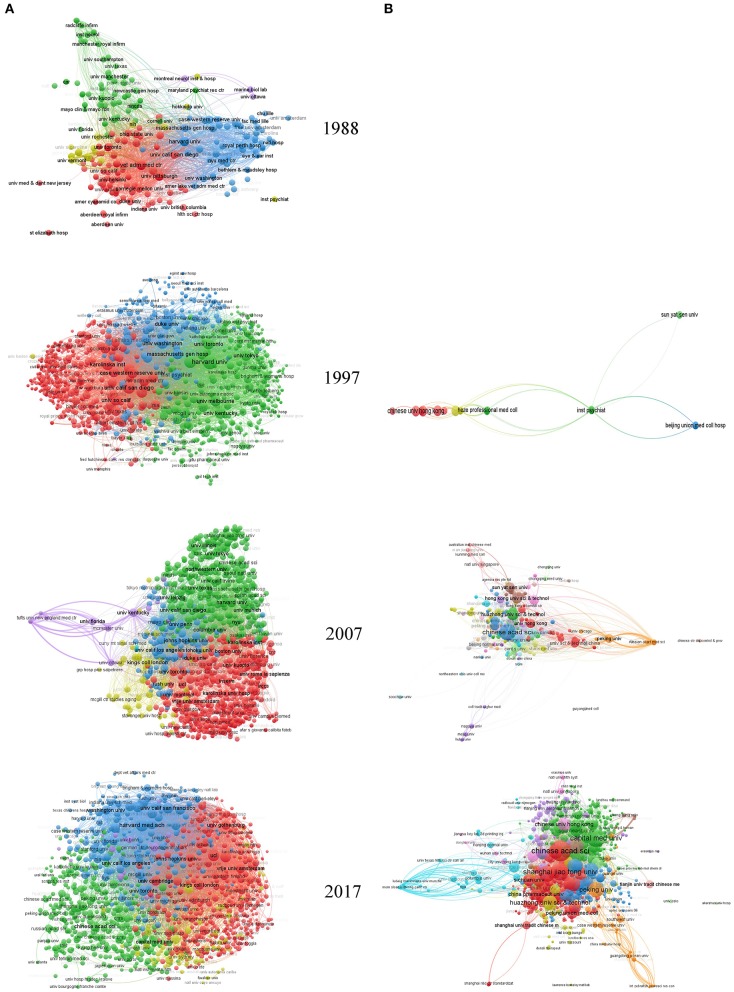
Figure 6.
Institution maps globally and in China. In this visualized network, each institution is represented by a node. Node size reflects the number of publications in the node, and two nodes are connected by a curved line if either of them cites the other. Curved lines between nodes reflect the connectivity of nodes, with line thickness representing the number of citations between two nodes. VOSviewer has its own clustering technique based on citation relations between clusters. Colors represent groups of nodes that are relatively strongly related to each other. (A) Global institution maps. (B) Institution maps in China.

