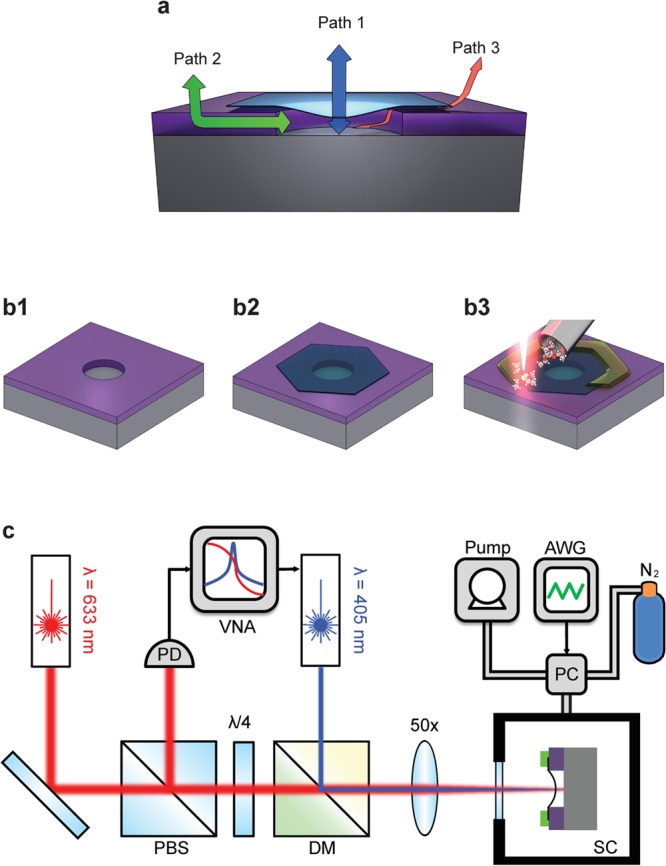
Figure 1.

(a) Illustration showing the three possible leakage pathways through which gases can leak. Blue: Path 1, through the defects in graphene. Green: Path 2, through the oxide. Red: Path 3, along the interface between graphene and the substrate. (b) Schematic showing the sealing procedure. (b1) Cavity is etched into a SiO2/Si substrate using standard e-beam lithography followed by reactive ion etching. (b2) MLG is deterministically transferred onto the cavity. (b3) Electron beam is scanned over the edge of MLG–SiO2 interface while gas injection system (GIS) introduces tetraethyl orthosilicate (TEOS), resulting in local deposition of SiO2. (c) Schematic of the interferometry setup. Sample is mounted in a sample chamber (SC) where the pressure is regulated by the pressure controller (PC) and the arbitrary waveform generator (AWG). A modulated blue laser with wavelength of 405 nm optothermally heats the suspended membrane. Intensity modulations in the reflected red laser light (λ = 633 nm), caused by the graphene motion, are measured by the photodiode (PD) and sent to the vector network analyzer (VNA). PBS, polarized beam splitter; DM, dichroic mirror.
