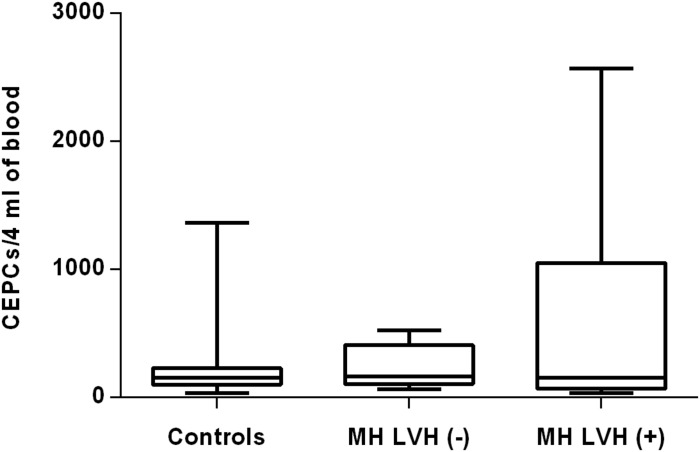
FIGURE 2.
CEPCs number in patients with and without LVH belonging to MH group. Box and whisker plots show median (central line), upper and lower quartiles (box) and range excluding outliers (whiskers). Data were analyzed using Kruskal-Wallis test followed by the Dunn’s multiple comparison test. P ≤ 0.05 was considered statistically significant.

