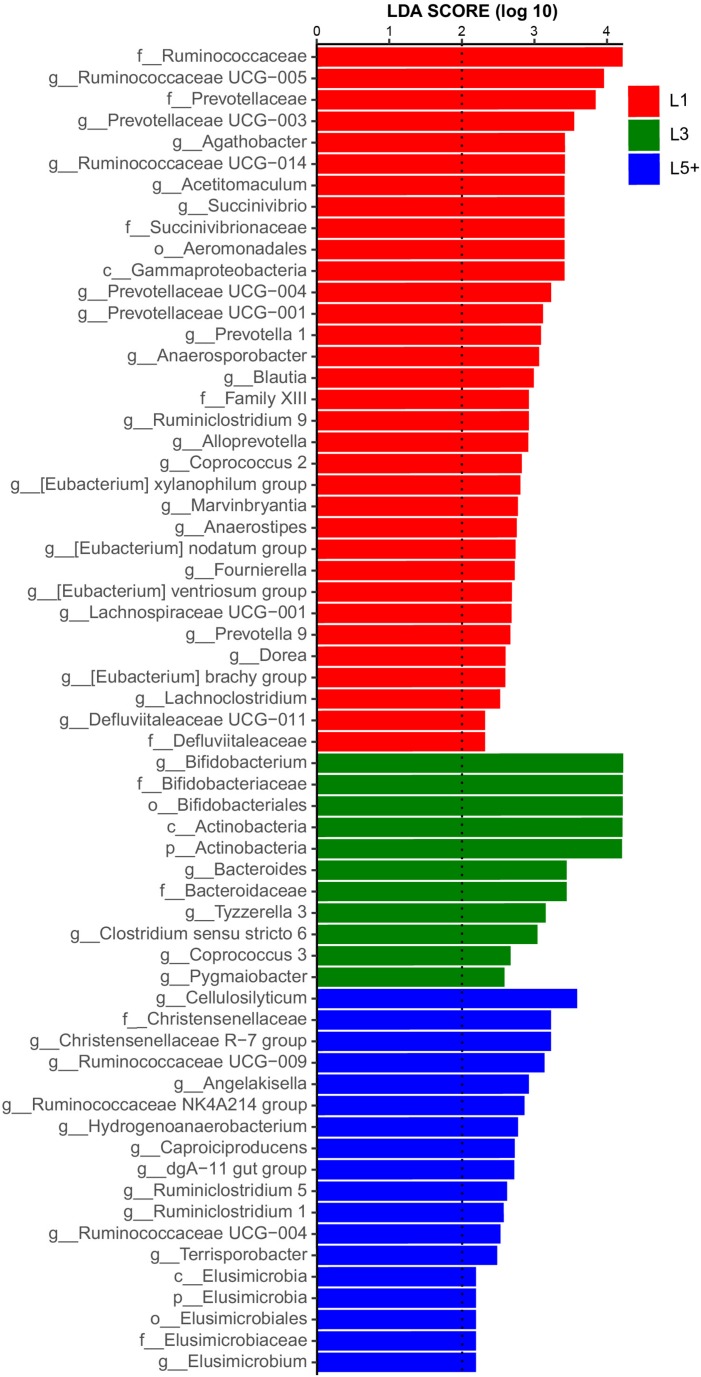
FIGURE 3.
Histogram of the LDA scores computed for differentially abundant fecal bacteria across three lactation groups. LEfSe scores could be interpreted as the degree of consistent difference in relative abundance of the analyzed fecal bacteria communities across the three lactation groups. The histogram thus identifies which clades among all those detected as statistically and biologically differentially abundant and could explain the greatest differences across the three groups. In brief, the blue bars, for example, represent the bacteria with the highest abundance in L5+ compared with those in the other two groups.

