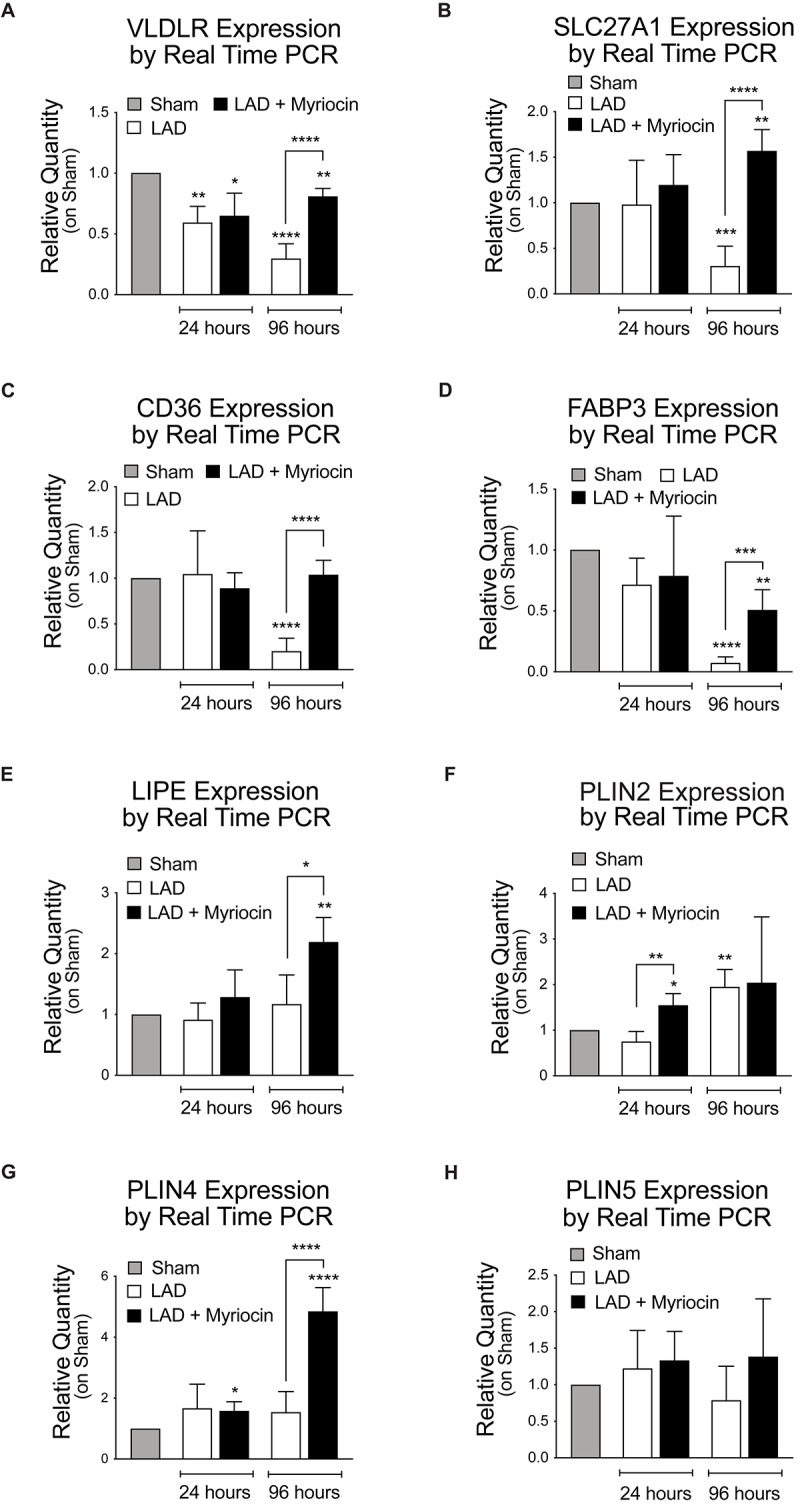
FIGURE 3.

Quantification of the expression levels of lipid transporters and proteins involved in their mobilization. qRT-PCR analysis of the plasma membrane transporters: VLDLR (A), SLCL27A1 (B), CD36 (C), FABP3 (D). qRT-PCR analysis of the FA mobilization enzymes and of the PAT family members: LIPE (E), PLIN2 (F), PLIN4 (G) and PLIN5 (H). All data are reported as relative quantity on sham group and are referred to 24 and 96 h after surgery. All data are expressed as mean ± SD. Statistical significance refers to I/R and SLN/myr treated I/R groups as compared to sham animals. The comparison between I/R and SLN/myr treated I/R groups is indicated by the connecting line (*p < 0.05; ∗∗p < 0.01; ∗∗∗p < 0.001; ****p < 0.0001). Sham animals: gray bar; I/R group: white bar; SLN/myr treated I/R group: black bar.
