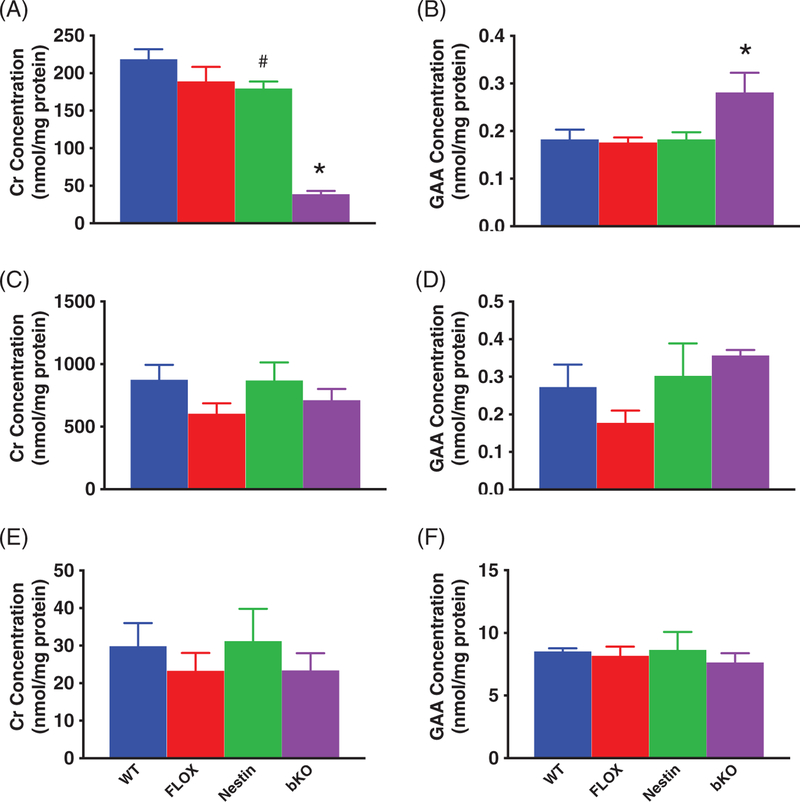
FIGURE 1.
Creatine and GAA levels in the brain, heart and kidney. A, BKO mice show reduced brain Cr levels compared with all control groups. Nestin mice had lower Cr levels than WT mice. B, GAA levels are increased in the brain of bKO mice. In the heart and kidney, Cr (C and E, respectively) and GAA (D and F) levels are unchanged.N = 5/group. Mean ± SEM. *P < .05 vs WT, FLOX and NESTIN, #P < .05 vs WT

