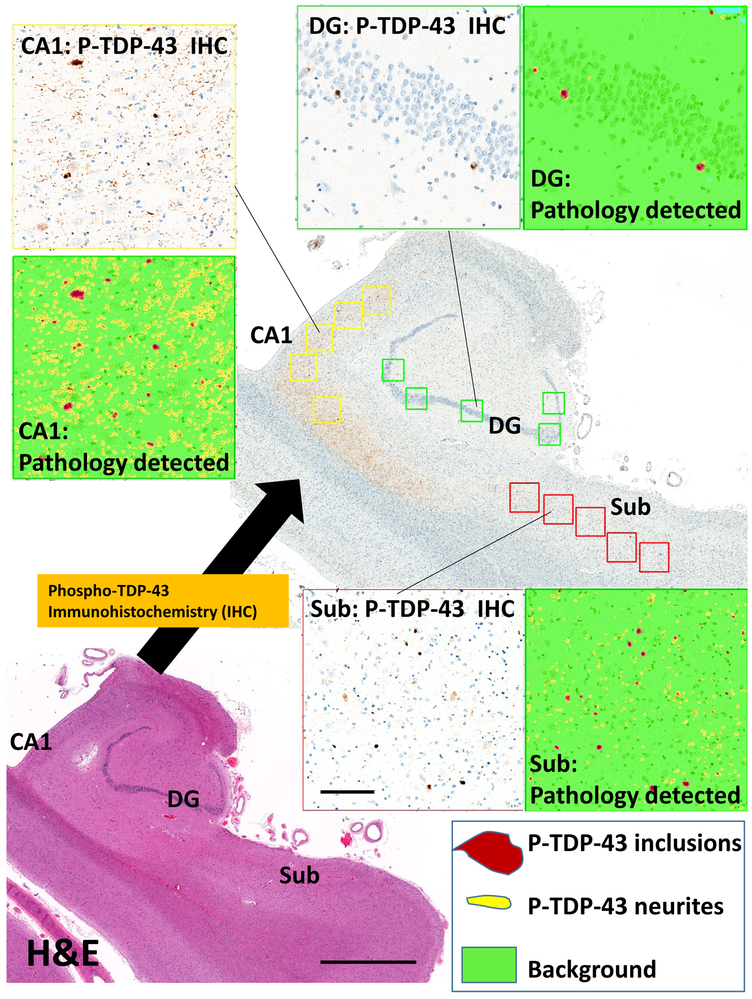
Figure 2. Representative section of the hippocampal formation, to convey digital assessment of TDP-43 pathologies in the CA1 subfield and dentate granule (DG) cells of the hippocampus proper, and in the subiculum (Sub).
The adjacent hematoxylin and eosin (H&E)-stained section (lower-left) helps to convey the anatomic landmarks, including CA1, Sub, and DG subregions. Rightward is medial. This hippocampus had extensive Phospho-TDP-43 immunoreactivity in the CA1 (upper left), dentate granule cells (upper right), and subiculum (lower right). The immunostained pathologies were detected using digital pathologic methods that quantitatively scored the number of inclusions (false-colored maroon in the insets) and neuritic-like structures (false-colored yellow); a color key is shown in the lower right. Scale bar = 2mm for the H&E stained photomicrograph and 200 microns for the inset boxes.

