
Fig. 3.
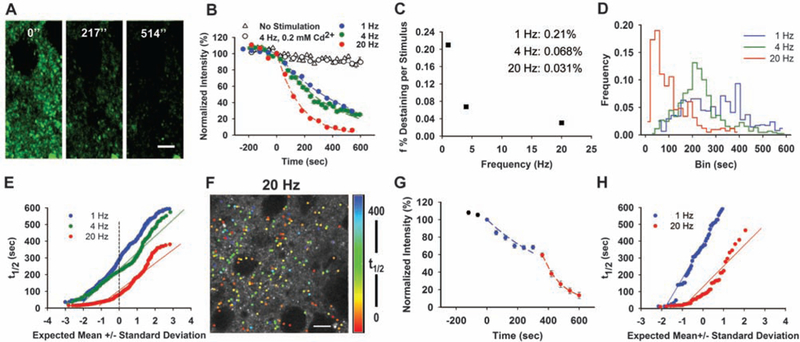
Frequency-dependent induction of multiple dopamine terminal populations. (A) Local stimulation at 4 Hz resulted in destaining from the terminals. Stimulation began at t = 0. Scale bar: 5 μm. (B) Destaining of FFN511 at4 Hz is Ca2+- and frequency-dependent. Controls received no stimulation (153 puncta from 3 slices). Destaining with cadmium chloride (200 μM) was identical to unstimulated controls (475 puncta from 5 slices). The destaining curves for each stimulation frequency were fit by a single exponential decay function and half-life (t1/2) values calculated as τ × 0.693 (1 Hz, 765 puncta from 9 slices; 4 Hz, 410 puncta from 7 slices; 20 Hz, 416 puncta from 6 slices). (C) The dependence of mean fractional release parameter (f, i.e., destaining per stimulus) on stimulus frequency. (D) Histogram of t1/2 values of individual dopamine terminals stimulated at 1 Hz, 4 Hz, and 20 Hz. Bin size, 20 s. (E) Normal probability plot of half-time values for each terminal at 1, 4, and 20 Hz. The deviation from normality was increased with stimulation frequency. (F) Spatial distribution of FFN511 destaining rates of individual puncta stimulated at 20 Hz are shown in false color. Scale bar, 10 μm. (G) Averaged destaining kinetics of 60 puncta from one region of a slice stimulated consecutively first at 1 Hz (blue) and then at 20 Hz (red). (H) Distribution of t1/2 values for the terminals in G; distribution at 1 Hz was well fit by a normal distribution, whereas the distribution deviated from normality at 20 Hz (movie S3).