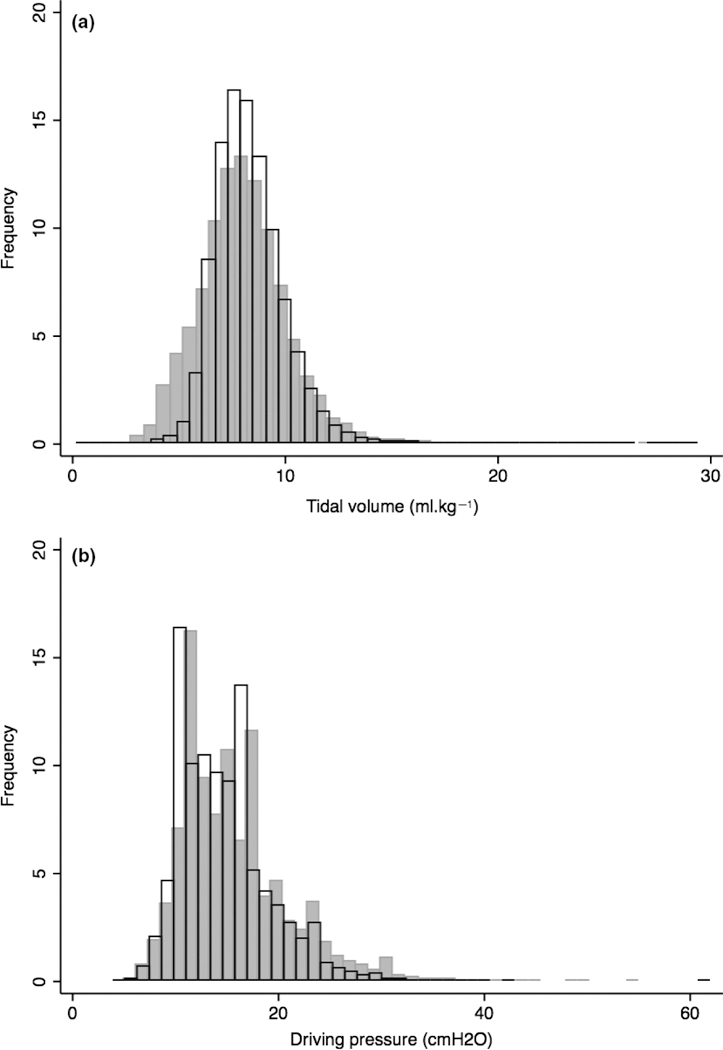
Figure 2.

(a) The tidal volumes and (b) the driving pressures delivered by pressure-controlled ventilation ( ) and volume-controlled ventilation (
 ) during surgery in 18,268 patients and 91,092 patients, respectively.

(a) The tidal volumes and (b) the driving pressures delivered by pressure-controlled ventilation ( ) and volume-controlled ventilation (
 ) during surgery in 18,268 patients and 91,092 patients, respectively.