
Figure 3. Scatterplot of Model Predictions.
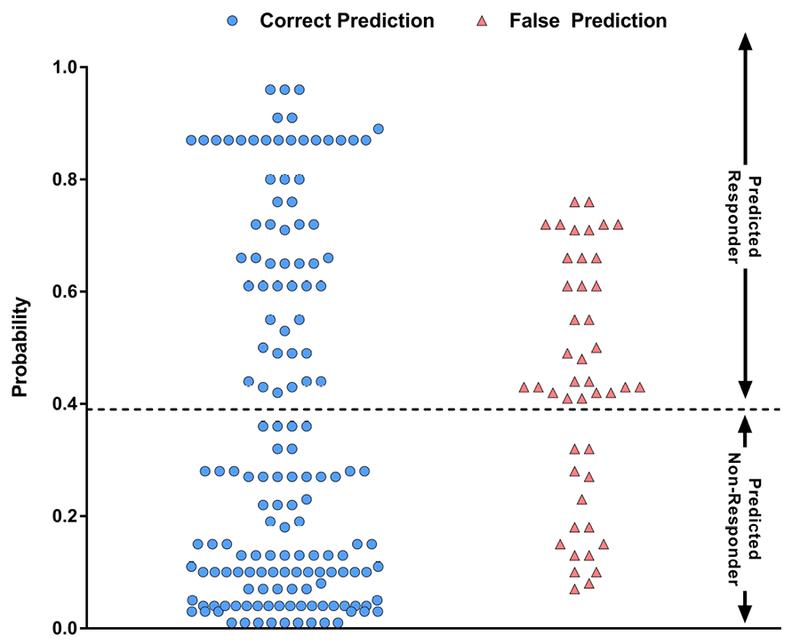
Scatterplot shows the probability of histologic response and accuracy of each prediction for all patients assessed in this analysis.
Official websites use .gov
A
.gov website belongs to an official
government organization in the United States.
Secure .gov websites use HTTPS
A lock (
) or https:// means you've safely
connected to the .gov website. Share sensitive
information only on official, secure websites.
Scatterplot shows the probability of histologic response and accuracy of each prediction for all patients assessed in this analysis.