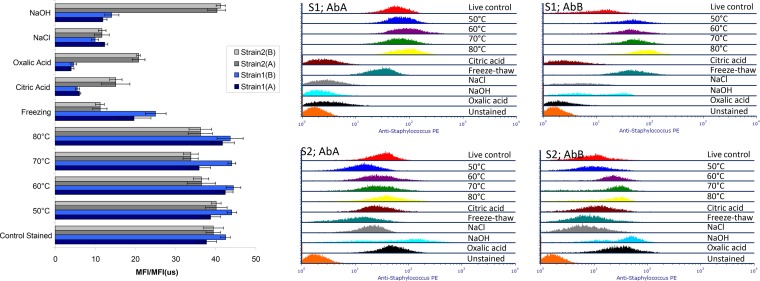
FIG 4.
Overlays of the PE fluorescence distributions of S. aureus exposed to various physical or chemical treatments (for an explanation of the labels, see Fig. 1) and stained with one of a pair of commercial anti-S. aureus antibodies, followed by staining with R-PE-conjugated secondary antibody. The left panel shows the average MFI/MFI(us) PE fluorescence values for the various treatments for both pairs of strains and antibodies.

