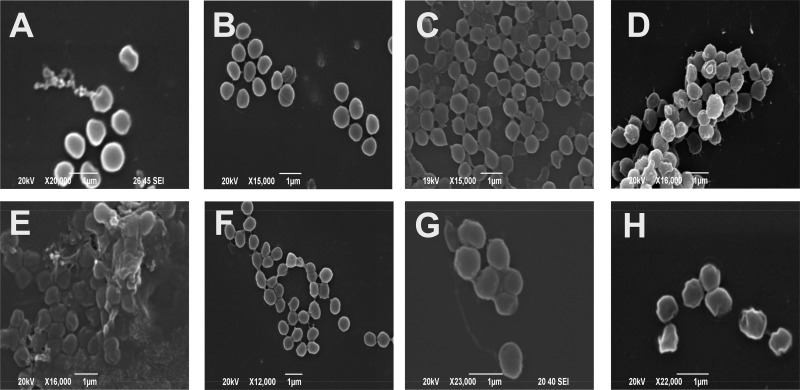
FIG 6.
Scanning electron micrographs of S. aureus cells. (A) Exponential-phase live control cells; (B) stationary-phase cells; (C) cells after freeze-thaw treatment; (D) cells after heating at 80°C for 10 min; (E) cells exposed to 2.5% (wt/vol) sodium hydroxide for 10 min; (F) cells exposed to 1% (wt/vol) citric acid for 10 min; (G) cells exposed to 1% (wt/vol) oxalic acid for 10 min; (H) cells exposed to 1% (wt/vol) sodium chloride for 10 min.

