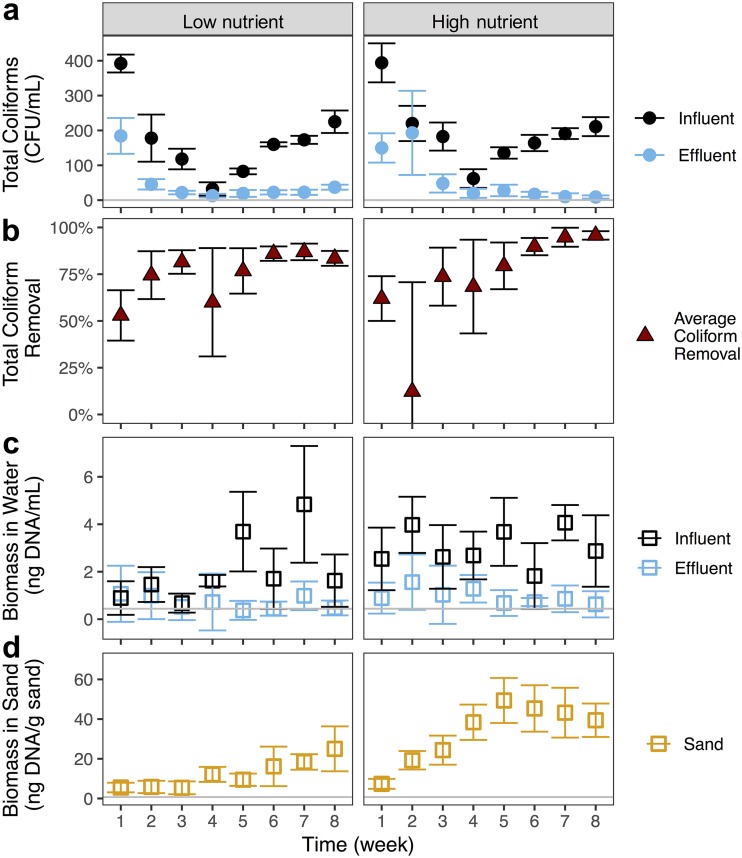
FIG 1.
Average total coliform concentrations over time in the influent and effluent waters (a) and average percent total coliform removal (b) of filters receiving low and high nutrient source waters. Microbial biomass measured by DNA yield over time in the influent and effluent (c) and sand (d) samples. Each point represents the mean, and error bars represent the standard deviation across five replicate samples of source water (influents) or five replicate biosand filters (effluents and sand). Gray lines indicate the detection limits.

