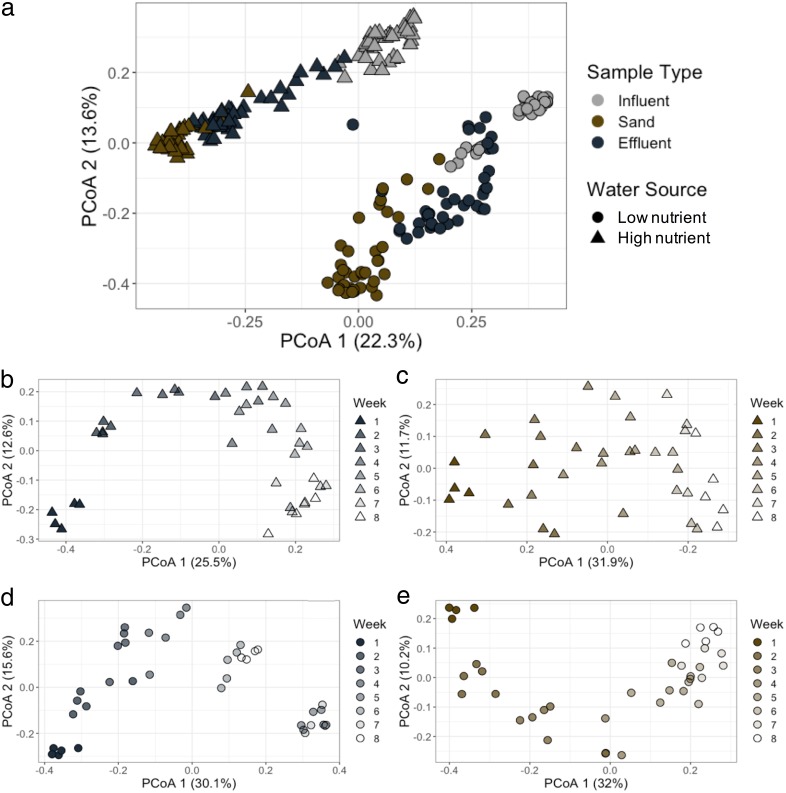
FIG 2.
Principal-coordinate analyses (PCoA) of microbial communities based on pairwise Bray-Curtis dissimilarity, comparing sample type and water source across all samples (a) and over time for high nutrient effluent (b), high nutrient sand (c), low nutrient effluent (d), and low nutrient sand (e). PCoA of influent microbial communities over time shown in Fig. S4. Note that the low nutrient influent was from a different source during weeks 5 and 7 (see Fig. 4).

