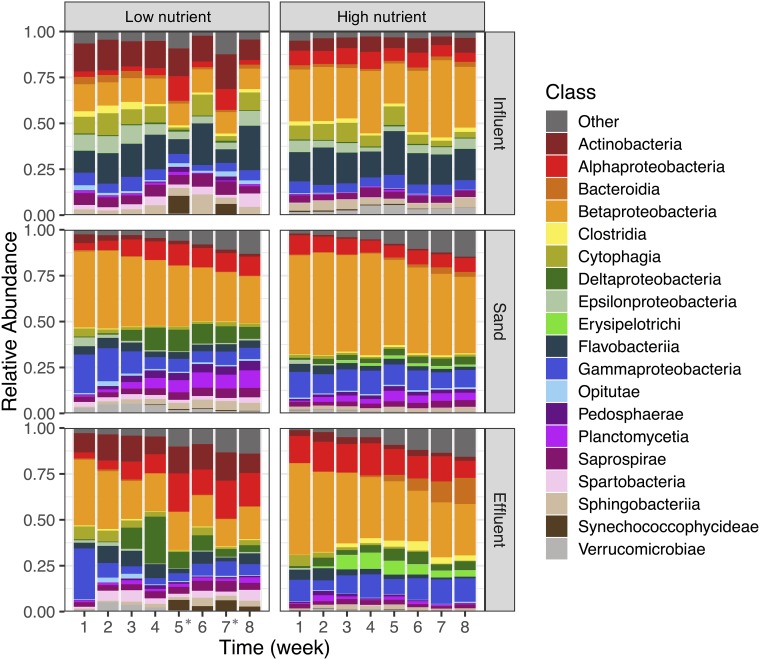
FIG 3.
Relative abundance of the 19 most abundant classes over time for the low nutrient (left) and high nutrient (right) water sources for samples from the influent (top), sand (middle), and effluent (bottom) over time. Each bar represents combined data from four to five replicates (results from individual replicates are presented in Fig. S2). * indicates that the low nutrient influent was from a different source during weeks 5 and 7.

