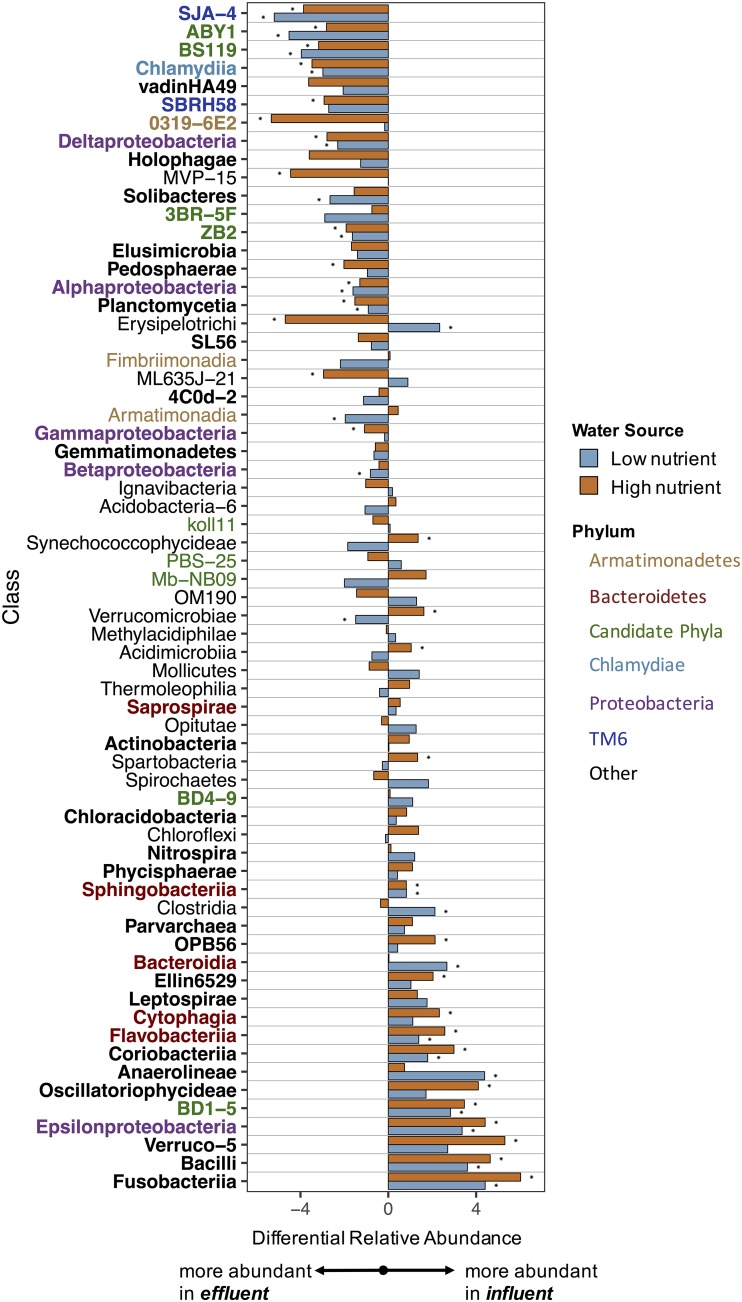
FIG 5.
Differential relative abundances between the influent and effluent of the most abundant microbial classes (>0.01% relative abundance) for each water source across all time points (for time resolved data see Fig. S6), ordered by the average differential relative abundance for both water sources. Bolded text labels indicate classes with the same trend in differential abundance between the two source waters. Stars indicate statistically significant differences (FDR, <1%). Text label colors indicate specific phyla of interest.

