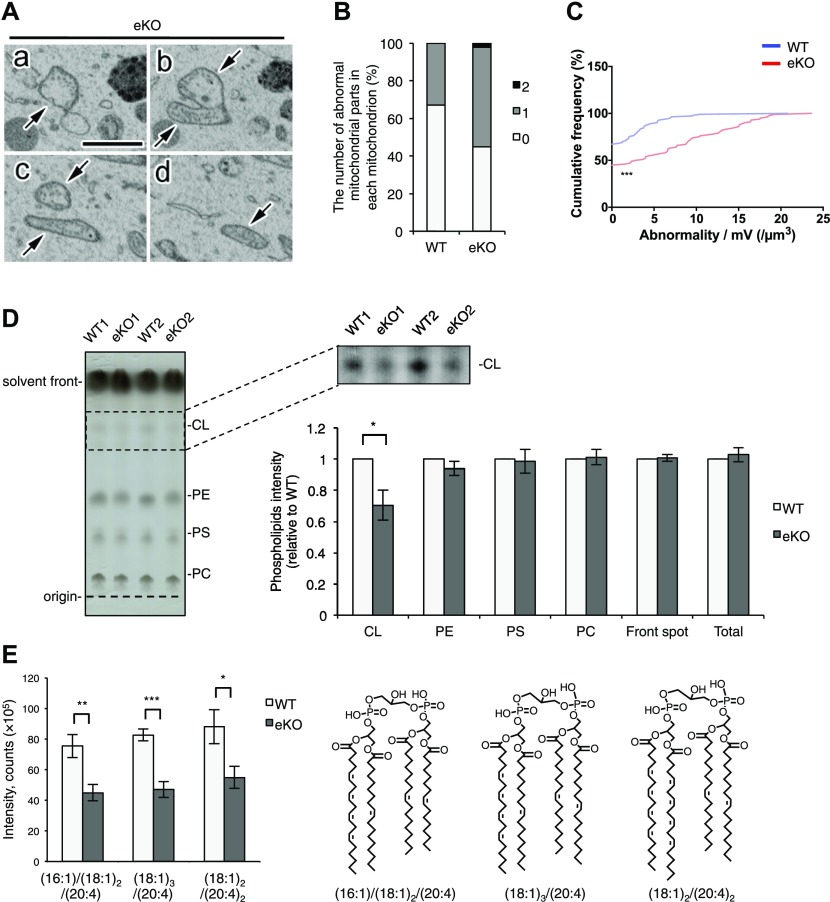
Figure 3. Reduced cardiolipin and disrupted cristae in MITOL KO neurons.
(A–C) Abnormal structures (“abnormality”) of mitochondria (arrows) in the SBF-SEM analysis of hippocampal neurons of 12-wk-old eKO (A). (A–D) The serial images are shown in (a–d). The connection between the abnormally swollen part and the normally appearing region is clearly observed in the serial images (a–d, arrows). Scale bar represents 2 μm. The bar graph showed the number of abnormal mitochondrial parts in each mitochondrion (B). Cumulative frequency of abnormal mitochondria per unit volume (C). More mitochondria have higher frequency of abnormality per unit mitochondrial volume in eKO. (n = 110 for mitochondria in cell body of WT and n = 100 for mitochondria in cell body of eKO; ***P < 0.001, U test). All error bars indicate SEM. (D) TLC separation of mitochondrial phospholipids isolated from combination of cerebral cortex and hippocampus. The right upper panel is processed from left panel to analyze CL. The right lower graph shows quantifications of each phospholipid in equal amount of mitochondrial fraction isolated from WT and eKO. (n = 5; *P < 0.05, t test). (E) Assessment of representative molecular species of CL in the same sample as above by LC/MS. (n = 5; *P < 0.05, **P < 0.01, ***P < 0.005, t test). All error bars indicate SEM. PE, phosphatidylethanolamine; PS, phosphatidylserine; PC, phosphatidylcholine; CL, cardiolipin.

