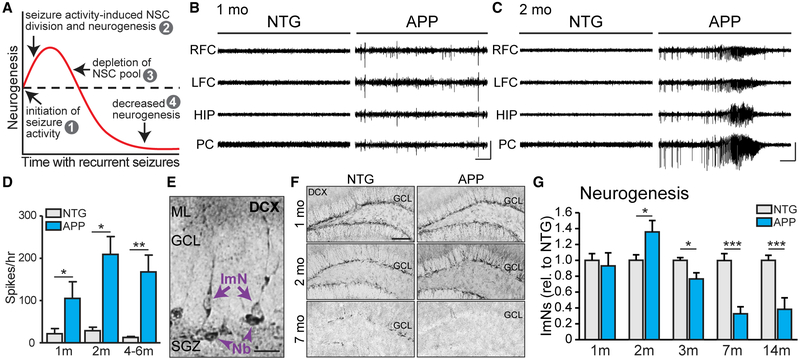
Figure 1. The Rate of Adult Hippocampal Neurogenesis in APP Mice Increases after Seizure Activity Starts and Then Decreases with Age.
(A) Model illustrating how seizure activity may induce changes in neurogenesis.
(B and C) Representative electroencephalogram (EEG) traces from NTG and APP mice at 1 and 2 months of age, with epileptiform spikes at 1 month of age (B) and a seizure at 2 months of age (C) in APP mice. Electrodes were in left and right frontal cortices (LFC and RFC), hippocampus (HIP), and parietal cortex (PC). Scale bars, 1 mV, 10 s.
(D) The number of epileptic spikes per hour in NTG or APP mice at 1, 2, and 4–6 months of age (n = 3–5 mice per genotype and age).
(E) Immunophenotyping of immature neurons (ImN) and neuroblasts (Nb) by examining morphology of cells that express doublecortin (DCX). Scale bar, 20μm.
(F) DCX staining in NTG and APP mice at 1, 2, and 7 months of age. Scale bar, 100 μm.
(G) DCX expression at 1 month of age (n = 9–12 mice per genotype) and number of DCX+ ImNs at 2 (n = 6 mice per genotype), 3 (n = 8 mice per genotype), 7 (n = 9–10 mice per genotype), and 14 (n = 11–12 mice per genotype) months of age, normalized to NTG at each time point.
*p < 0.05; **p < 0.01; ***p < 0.001; two-tailed unpaired Student’s t test comparing means between NTG and APP mice at each age. Values indicate mean ± SEM. See also Figures S1–S4 and Tables S1 and S2.

