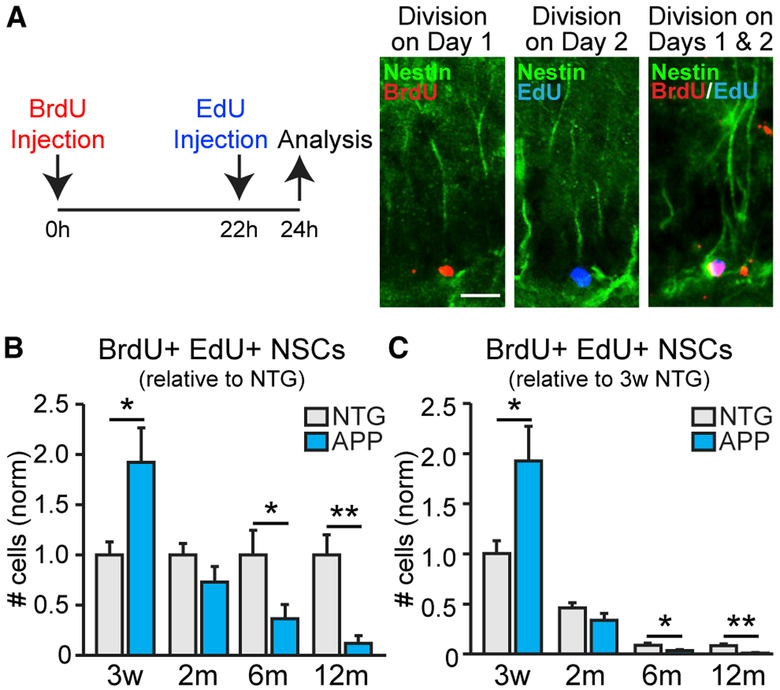
Figure 3. APP Mice Have Higher Fraction of NSCs Engaged in Consecutive Divisions Early in Life than NTG Mice Do.
(A) Administration of BrdU and EdU 22 h apart captures NSCs that were dividing only on day 1 (BrdU+ NSCs), only on day 2 (EdU+ NSCs), or on both days 1 and 2 (BrdU+ EdU+ NSCs; “consecutively dividing NSCs”). Scale bar, 20 μm.
(B and C) Number of consecutively dividing NSCs at 3 weeks (n = 6 mice per genotype) and at 2 (n = 6–8 mice per genotype), 6 (n = 6–8 mice per genotype), and 12 (n = 5–8 mice per genotype) months of age, normalized to the average of the NTG mice at each time point (B) or 3-week-old NTG mice (C).
*p < 0.05; **p < 0.01; two-tailed unpaired Student’s t test comparing means between NTG and APP mice at each age. Values indicate mean ± SEM. See also Figure S6 and Tables S1 and S2.

