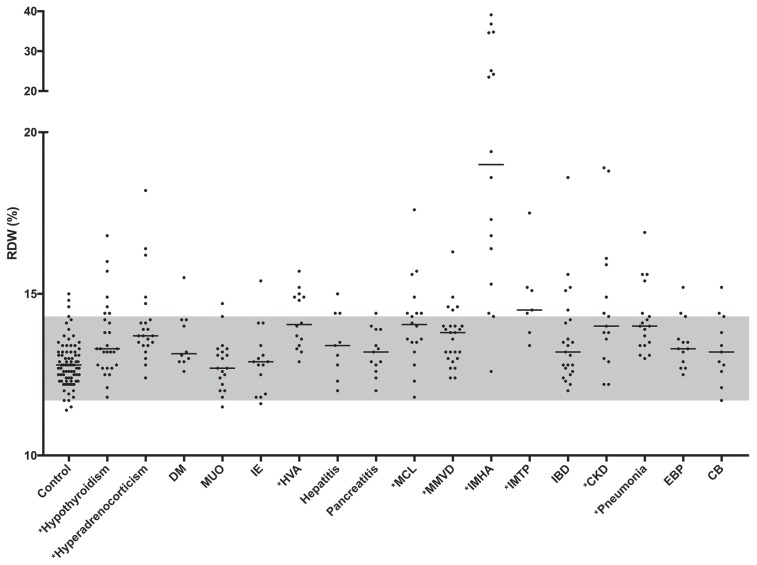
Figure 1.
Red blood cell distribution width (RDW) in all groups. The median value for each group is represented by a solid line. The reference interval established from the healthy control group is represented in gray. Asterisks (*) indicate the groups with significantly increased RDW values. DM — diabetes mellitus; MUO — meningitis of unknown origin; IE — idiopathic epilepsy; HVA — hepatic vascular anomaly; MCL — multicentric lymphona; MMVD — myxomatous mitral valve degeneration; IMHA — immune-mediated hemolytic anemia; IMTP — immune-mediated thrombocytopenia; IBD — inflammatory bowel disease; CKD — chronic kidney disease; EBP — eosinophilic bronchopneumopathy; CB — chronic bronchitis.

