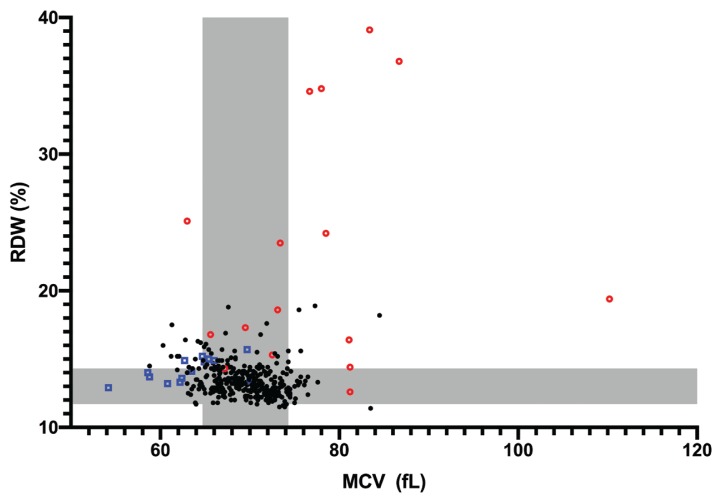
Figure 2.
Correlation between red blood cell distribution width (RDW) and mean corpuscular volume (MCV) values. The reference intervals established from the control group are represented in gray. Blue squares represent dogs with HVA. Red circles represent dogs with IMHA. Abbreviations listed in Figure 1.

