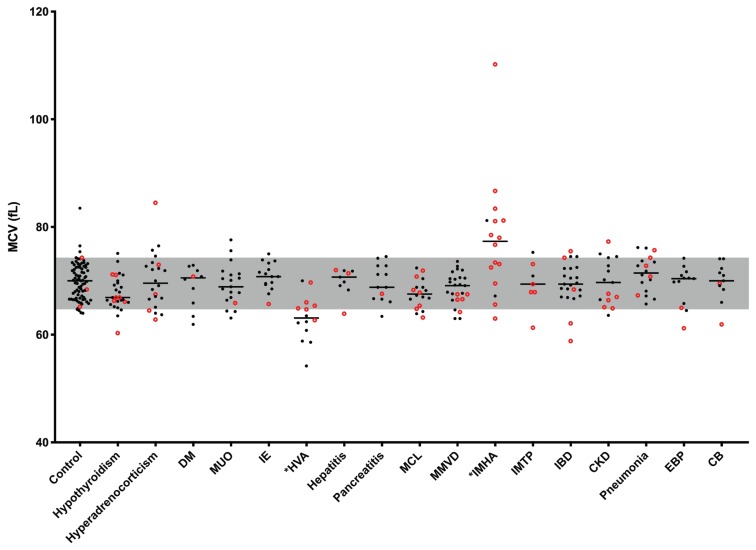
Figure 3.
Mean corpuscular volume (MCV) in all groups. The median value for each group is represented by a solid line. The MCV values of dogs with an increased RDW are represented by red circles. The reference interval established from the control group is represented in gray. Asterisks (*) indicate the groups with significantly different values. Abbreviations listed in Figure 1.

