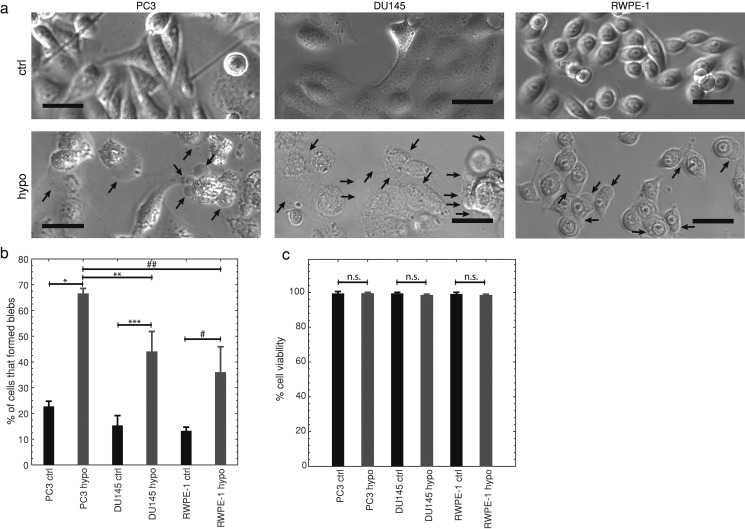
FIG. 3.
(a) Representative bright-field images of highly metastatic PC3, moderately metastatic DU145, and normal RWPE-1 prostate cells in control iso-osmotic (ctrl) and hypo-osmotic (hypo) media for 12 h. Arrows indicate blebs, scale bars represent . Images were linearly contrast enhanced by stretching gray scale values from the ranges [11, 199] (ctrl) and [0, 153] (hypo) to [0, 255] for PC3; [0, 130] (ctrl) and [22,210] (hypo) to [0,255] for DU145; and [0,163] (ctrl and hypo) to [0,255] for RWPE-1. Displayed images are cropped. (b) The average percentage of cells SD that formed blebs in hypo-osmotic media for 12 h in comparison with control, , , *, **, ***, one-way ANOVA followed by Tukey’s post hoc test. Highly metastatic PC3 control , PC3 hypo-osmotic , moderately metastatic DU145 control , DU145 hypo-osmotic , normal RWPE-1 control , RWPE-1 hypo-osmotic . (c) Average viability SD of hypo-osmotically treated (12 h) and control cells determined by Trypan blue stain exclusion. N.s. indicates no statistical significance, two-sample Kolmogorov–Smirnov test. Averages were obtained from 3 independent experiments.

