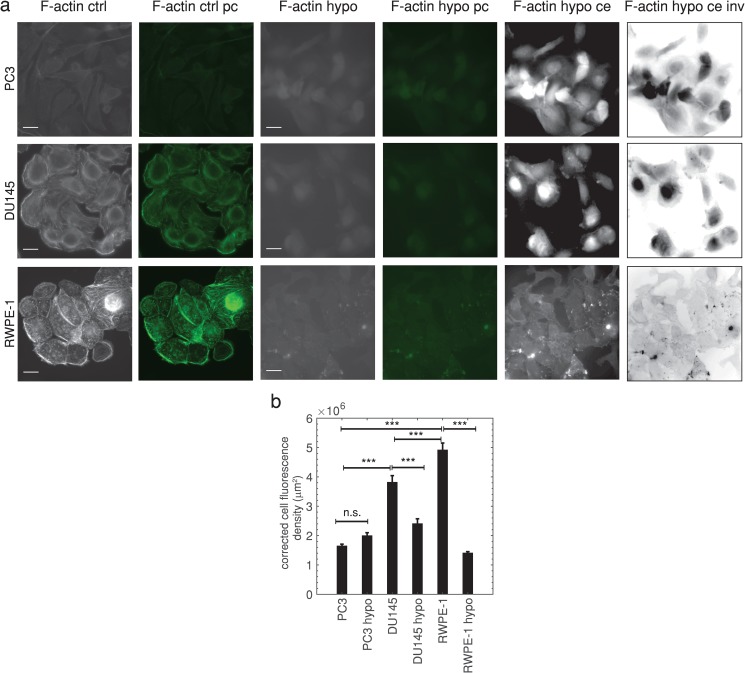
FIG. 5.
(a) Fluorescence and green pseudocolor (pc) images of prostate cells labeled with F-actin specific Phalloidin-488 stain in iso-osmotic (ctrl) and hypo-osmotic (hypo) conditions. Scale bars represent . Both linearly contrast enhanced (ce) and inverted linearly contrast enhanced mages (ce inv) are also shown for hypo conditions to enable visualization of cell boundaries. The following grayscale values were rescaled: [20, 120] to [0, 255] for PC3 hypo ce; [32, 50] to [0, 255] for DU145 hypo ce; [35, 81] to [0, 255] for RWPE-1 hypo ce. (b) Average corrected cell fluorescence density SEM for control (ctrl) and hypo-osmotic (hypo) conditions, (), ***, one-way ANOVA followed by Tukey’s post hoc test. Additional comparisons were not statistically significant (). Highly metastatic PC3 control , PC3 hypo-osmotic , moderately metastatic DU145 control , DU145 hypo-osmotic , normal RWPE-1 prostate control , RWPE-1 hypo-osmotic . Averages were taken from 3 independent experiments.

