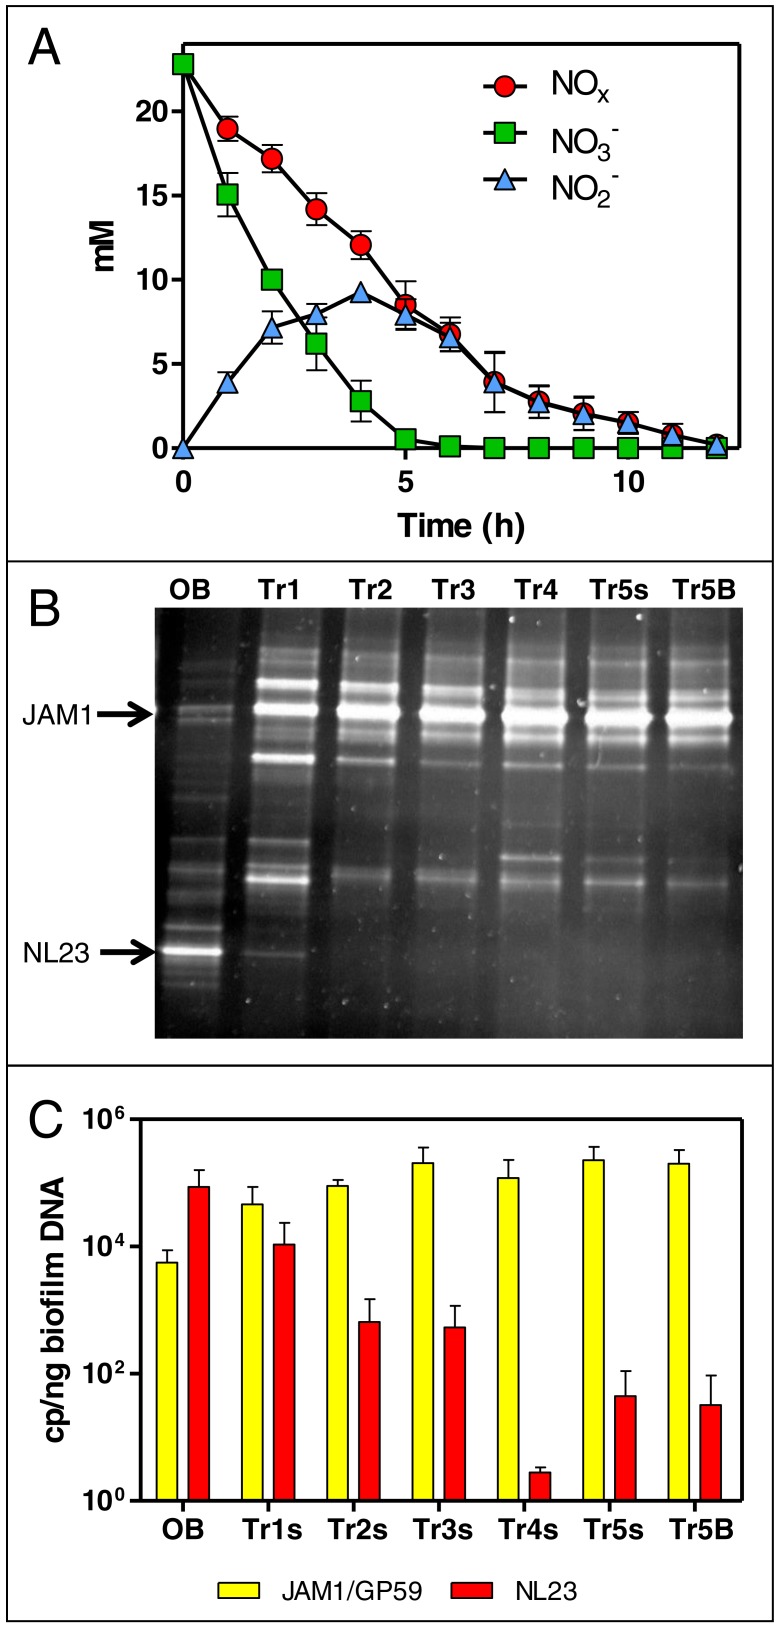
Figure 1. Dynamics of NO and NO concentrations and of the bacterial community in the Ref300N-23C biofilm cultures.
(A) NO and NO concentrations were measured during the fifth carrier-transfer cultures. Results from triplicate biofilm cultures. (B) PCR-DGGE migration profiles representing the bacterial diversity during the first five carrier-transfer cultures. DNA extraction was performed on samples from the suspended biomass in the first four carrier-transfer cultures because the biofilm was not enough abundant on the carriers in these cultures. In the fifth carrier-transfer cultures, samples were taken from the suspended biomass (Tr5s) and the biofilm (Tr5B). OB: Original biofilm. Approximately 300 ng of the PCR product was loaded per sample. (C) Quantification of M. nitratireducenticrescens strains JAM1/GP59 (narG1) and H. nitrativorans strain NL23 (napA) by qPCR in the five carrier-transfer cultures (Tr1 to Tr5). Results from 3 to 9 replicate cultures, of one to three different inoculums.

