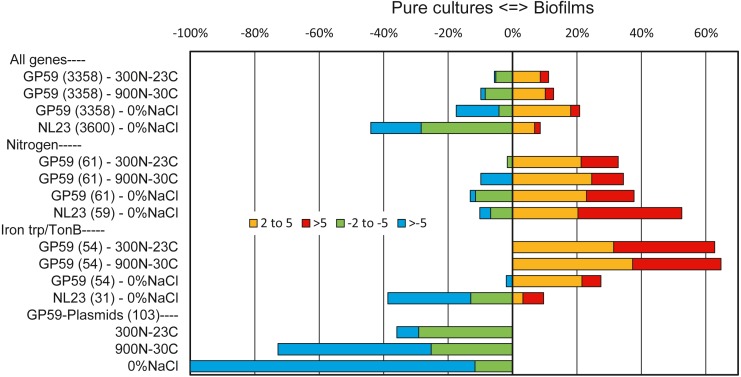
Figure 2. Relative expression profiles of M. nitratireducenticrescens GP59 and H. nitrativorans NL23 in biofilm cultures.
All the deduced amino acid sequences associated to the genome and plasmids of strain GP59 and the genome of strain NL23 were submitted to the BlastKOALA (genome annotation and KEGG mapping) at the Kyoto encyclopedia of genes and genomes (KEGG). Genes associated to specific metabolisms were sorted out and the corresponding ratios of the Biofilm Transcripts Per Million (TPM) versus the pure culture TPM were derived. When the ratios were <1, the negative inverse values (−1/ratio) were calculated. Data are expressed as the percentage of genes in each category that are more expressed in the biofilm cultures (right, 2–5 times, and > 5 times) or in pure cultures (left, −2 to −5 times and > −5 times). Number within parentheses is the number of genes involved in the selected pathways. Other metabolic profiles are detailed in Figs. S3 and S4.

