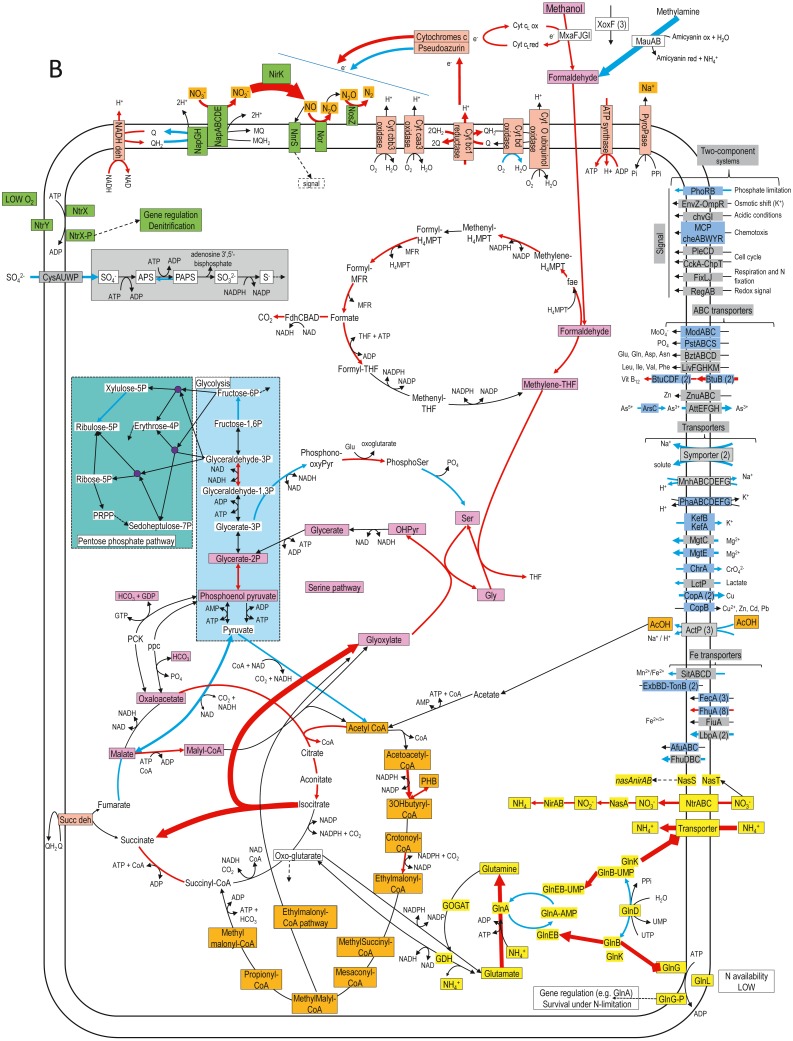
Figure 4. Relative gene expression profiles of selected metabolic pathways of H. nitrativorans strain NL23 in the 0% NaCl biofilm cultures.
The pathways are based on functions deduced by the annotations (provided by KEGG BlastKoala, RAST and GenBank). The arrow thickness is proportional to the value of the ratio of the biofilm-culture TPM divided by the planktonic pure-culture TPM. The blue arrows represent genes with at least 2-fold lower relative transcript levels in the biofilm cultures. The red arrows represent genes with at least 2-fold higher relative transcript levels in the biofilm cultures. The black arrows represent no changes between both types of cultures in the relative transcript levels. The two-component systems and the transporters that are illustrated in blue are encoded by strains GP59 and NL23. See Documents S9 and S10 for gene description.

