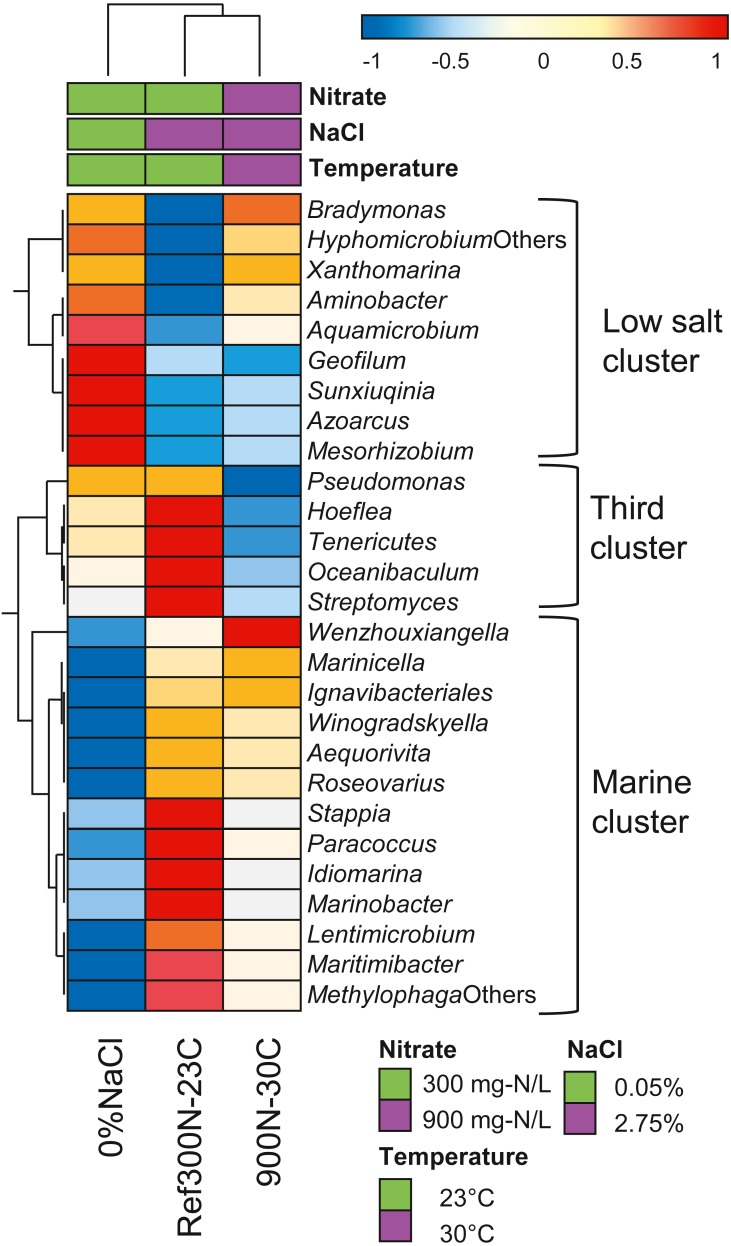
Figure 5. Hierarchical clustering of selected bacterial taxa in biofilm culture metatranscriptomes.
Heatmap represents differences in the overall gene expression patterns (expressed as TPM; from Table 6) (log10 [TPM by geometric average of TPM]) between the three biofilm cultures for the respective bacterial taxa. Analysis was performed at ClustVis web site (https://biit.cs.ut.ee/clustvis/) (Metsalu & Vilo, 2015).

