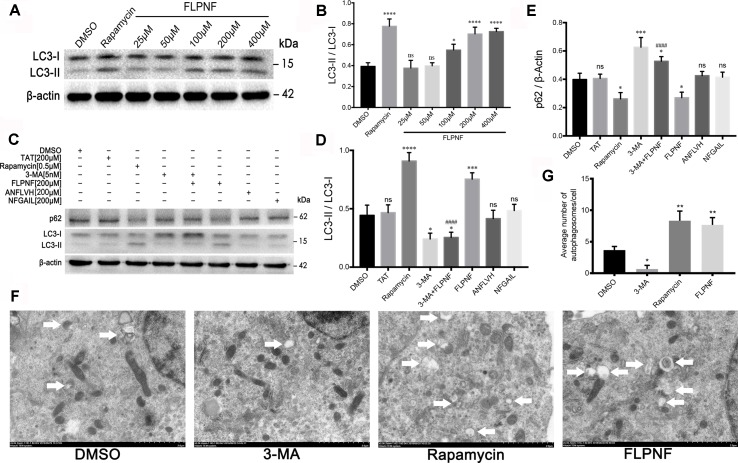
Figure 2.
Peptide FLPNF significantly increases the autophagosomal number in hIAPP-INS-1 cells. (A) Western blot analysis revealed changes in LC3-I and LC3-II at different concentration of the peptide FLPNF. β-actin was used as loading control. (B) The graph represents the quantification of LC3-II protein levels (n = 4). *p < 0.05, ****p < 0.0001, and ns vs. DMSO group. (C) Protein levels of LC3 and p62 were assessed by Western blot in hIAPP-INS-1 cells after exposure to 200 µM peptide FLPNF for 24 h. Rapamycin (0.5 µM for 6 h), 3-MA (5 nM for 6 h), peptide ANFLVH (200 µM for 24 h), and peptide NFGAIL (200 µM for 24 h) were used as a control. (D) and (E) The graph represents the quantification of LC3-II and p62 protein levels, respectively (n = 4). *p < 0.05, ***p < 0.001, ****p < 0.0001, and ns vs. DMSO group. #### p < 0.0001 vs. peptide FLPNF group. (F) Autophagy was evaluated using TEM, autophagosome are represented by double membrane vesicles and denoted with white arrow. Magnification 50,000×. (G) Quantification of the average number of autophagosomes per cell was determined by counting manually in 30 randomly selected cells for each group (n = 3). *p < 0.05 and **p < 0.01 vs. DMSO group.

