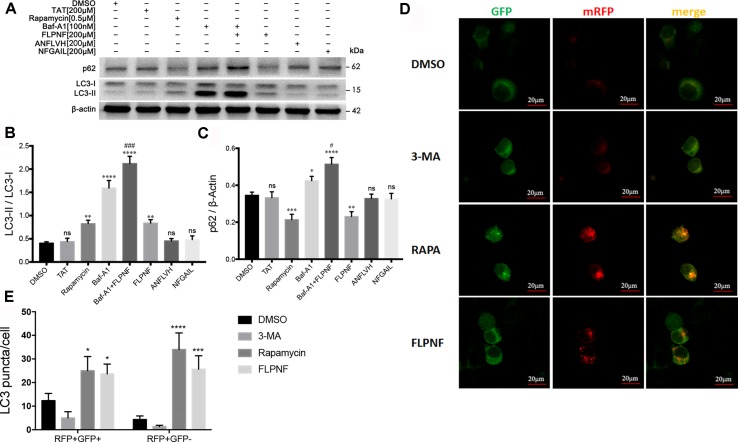
Figure 3.
Peptide FLPNF significantly induces the autophagy flux in hIAPP-INS-1 cells. (A) Protein levels of LC3 and p62 were assessed by Western blot in hIAPP-INS-1 cells after exposure to 200 µM peptide FLPNF for 24 hours. Autophagosome-lysosome fusion inhibitor bafilomycin-A1 (100 nM) was used to confirm the peptide FLPNF-induced autophagy flux. (B) and (C) The graph represents the quantification of LC3-II and p62 protein levels, respectively (n = 4). *p < 0.05, **p < 0.01, ***p < 0.001, ****p < 0.0001, and ns vs. DMSO group. # p < 0.05 and ### p < 0.001 vs. Baf-A1 group. (D) Representative confocal fluorescent images of hIAPP-INS-1 cells-expressing mRFP-GFP-LC3. Yellow puncta represent autophagosomes and red puncta for autolysosomes, which were quantified in the (E) (n = 4). *p < 0.05, ***p < 0.001, and ****p < 0.0001 vs. DMSO group.

