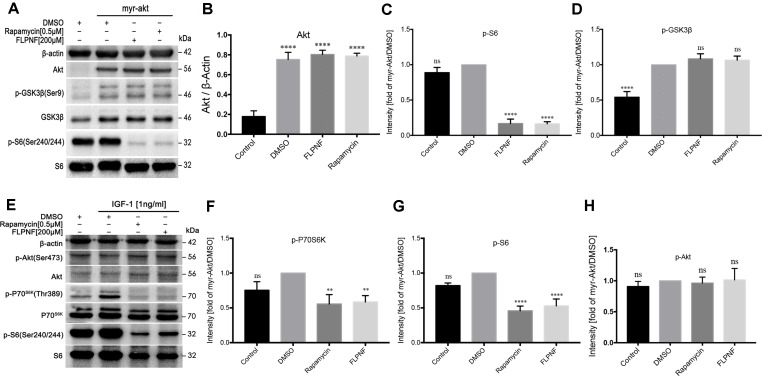
Figure 5.
Peptide FLPNF inhibits mTORC1 but not mTORC2 activity. (A) Protein levels of Akt, phosphorylated S6, and phosphorylated GSK3β were assessed by Western blot in HEK-293 cells expressing either a control vector or a myr-Akt expression vector after exposure to 200µM peptide FLPNF for 24 h. (B) The graph represents the quantification of Akt protein levels (n = 4). ****p < 0.0001 vs. control group. (C) and (D) The graph represents the quantification of phosphorylated S6 and GSK3β protein levels, respectively (n = 4). Band intensities were quantified and statistically analyzed relative to myr-Akt-expressing/DMSO-treated cells. ****p < 0.0001, and ns vs. myr-Akt-expressing/DMSO-treated group. (E) Protein levels of phosphorylated P70S6K, S6, and Akt were assessed by Western blot in hIAPP-INS-1 cells after exposure to 200 µM peptide FLPNF for 24 h. IGF-1 (1 ng/mL) was added for the final 20 min. (F–H) The graph represents the quantification of phosphorylated P70S6K, S6, and Akt protein levels, respectively (n = 4). Band intensities were quantified and statistically analyzed relative to IGF-1/DMSO-treated cell. **p < 0.01, ****p < 0.0001, and ns vs. IGF-1/DMSO-treated group.

