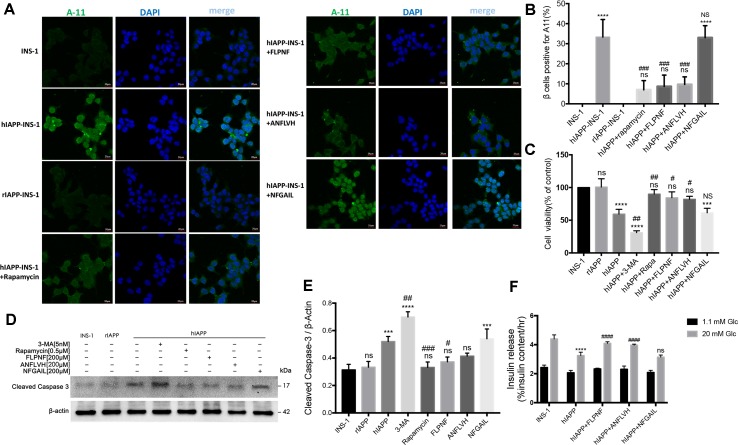
Figure 7.
Peptide FLPNF reduces hIAPP oligomer accumulation and protects INS-1 cells from hIAPP cytotoxicity. (A) Fluorescence microscopy images of hIAPP oligomer stained with anti-oligomer antibody A11 (oligomer, green; nuclei, blue). (B) The quantification of the percentage of β cells positive for cytosolic A11, indicated as bright green puncta deposited around the cell nucleus with larger puncta in the cytoplasm in hIAPP-INS-1 cells (n = 3). ****p < 0.0001 and ns vs. INS-1 cells group. ### p < 0.001 and NS vs. hIAPP-INS-1 cell group. (C) The cellular viability of hIAPP-INS-1 cells after exposure to 200 µM peptide FLPNF for 24 h (n = 4). ***p < 0.001, ****p < 0.0001, and ns vs. INS-1 cells group. # p < 0.05, ## p < 0.01, and NS vs. hIAPP-INS-1 cell group. (D) The protein levels of cleaved caspase 3 was assessed by Western blot after exposure to 200 µM peptide FLPNF for 24 h, and quantification shown in (E). The band intensities were quantified and statistically analyzed relative to untreated INS-1 cell (n = 4). ***p < 0.001, ****p < 0.0001, and ns vs. INS-1 cell group. # p < 0.05, ## p < 0.01, and ### p < 0.001 vs. hIAPP-INS-1 cell group. (F) Glucose-stimulated insulin secretion assay of cells after exposure to 200 µM peptide FLPNF for 24 h (n = 4). The data are expressed as percentages of total insulin content. ****p < 0.0001 vs. INS-1 cell group. #### p < 0.0001, and ns vs. hIAPP-INS-1 cell group.

