
Fig 1. Failure of adaptive myelination in a mouse model of MTX CRCI.
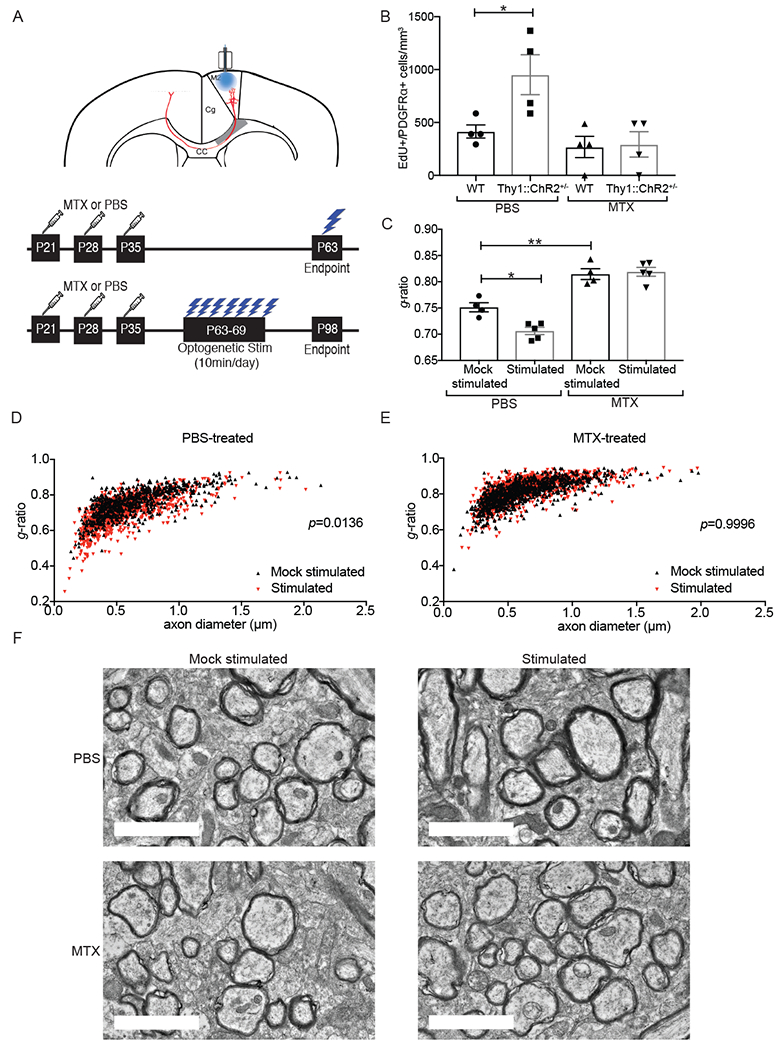
A) (Above) Coronal section of mouse brain, with prefrontal cortex areas labeled (M2 = premotor cortex; Cg = cingulate cortex). Optogenetic stimulation of premotor (M2) projection neurons, with analysis of oligodendroglial lineage cells in the corpus callosum (CC) in the region of premotor projections (shaded grey). (Below) Timelines of methotrexate (MTX) treatment and optogenetic stimulation (single and 7-day stimulation paradigms).
B) MTX abrogates activity-regulated OPC proliferation. Density of EdU-marked OPCs in the corpus callosum of Thy1::ChR2+/− mice and identically manipulated WT (no opsin) mice that were previously exposed to MTX or PBS vehicle control at 3-hours following a single optogenetic stimulation session. n=4 mice per group.
C) MTX abrogates activity-regulated myelination. TEM was performed one month following the end of the 7-day optogenetic stimulation paradigm in Thy1::ChR2+/− mice that were either stimulated or identically manipulated (mock-stimulated controls) that were previously exposed to MTX of PBS vehicle control. Myelin sheath thickness (g-ratio) analyzed at the level of the cingulum of the corpus callosum. n = 4-5 mice/group.
D-E) g-ratio shown as a function of axon caliber in scatterplot of all axons measured in (D) PBS vehicle control-treated, mock-stimulated mice (n = 4; black triangles) compared to PBS vehicle control-treated, optogenetically stimulated mice (n = 5; red triangles) and in (E) MTX-treated, unstimulated mice (n = 4; black triangles) compared to MTX-treated, optogenetically stimulated mice (n = 5; red triangles). A single point indicates the g-ratio for a single axon; ~100 axons quantified. P-values (indicated on plots) determined by comparing the mean g-ratio per mouse between groups.
F) Representative TEM images of premotor projections. Scale bars=2μm.
Data shown as mean ± SEM (B, C). Each point = one mouse (B, C). ns = p > 0.05, *p < 0.05, **p < 0.01, two-way ANOVA with Tukey post-hoc analysis for multiple comparisons. See also Figure S1.