
Fig 6. TrkB partial agonist LM22A-4 normalizes myelination and rescues cognitive behavioral function after methotrexate chemotherapy exposure.
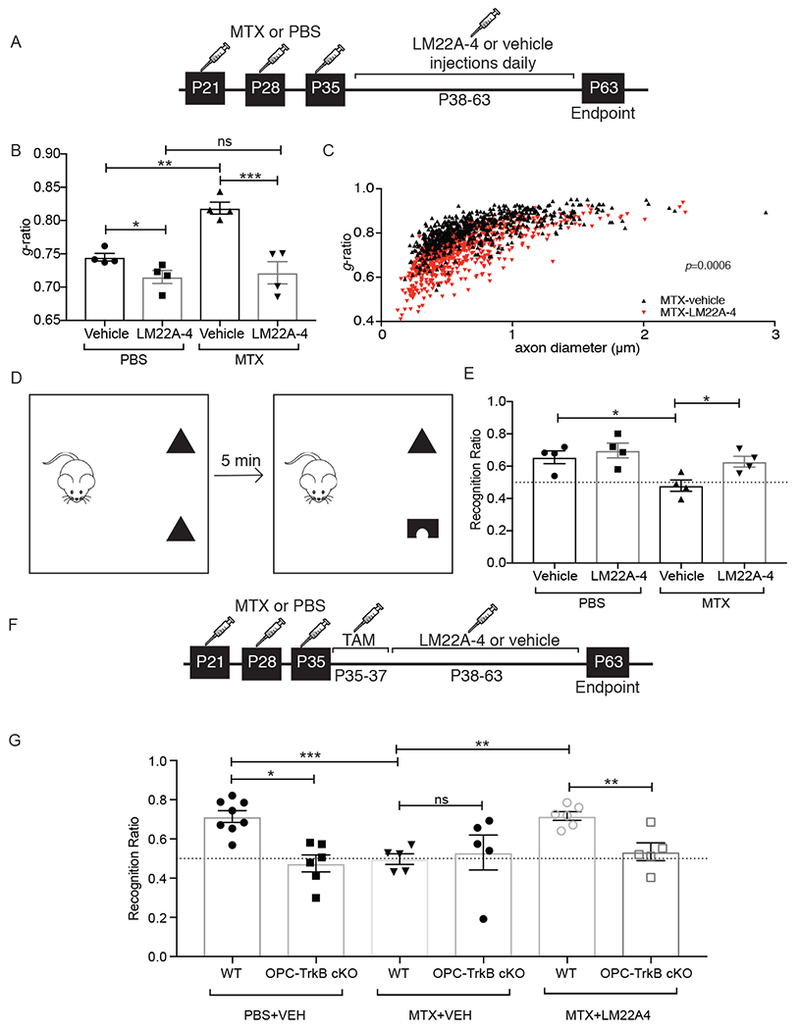
A) Schematic of LM22A-4 treatment in MTX CRCI model, with MTX or PBS vehicle control at P21, 28 and 35 followed by daily LM22A-4 or vehicle control administration from P38-P63.
B) Treatment with LM22A-4 rescues myelin deficits after MTX. TEM performed at P63 and g-ratios measured at the level of the cingulum of the corpus callosum. Bar graphs representing the g-ratio data shown in C and Fig. S6. n=4 mice/group.
C) Scatterplot of g-ratios as a function of axon caliber in MTX+LM22A-4-treated mice (n=4; red triangles) compared to MTX+vehicle control-treated mice (n=4; black triangles). A single point indicates the g-ratio for a single axon; ~100 axons quantified for each mouse. P-values (indicated on plots) determined by comparing the mean g-ratio per mouse between groups.
D) Schematic of Novel Object Recognition Test (NORT). Preference for novel object measured as the percent time spent with novel object over the total time spent with either object (recognition ratio).
E) LM22A-4 rescues the cognitive behavioral impairment observed after MTX. NORT performance in mice previously exposed to MTX or PBS vehicle control and subsequently treated with LM22A-4 or vehicle control. (n=4 mice in each group).
F) Schematic of LM22A-4 treatment in MTX CRCI model, with tamoxifen (TAM) induction of OPC TrkB cKO prior to LM22A-4 exposure.
G) TrkB expression in OPCs is required for LM22A-4 rescue of cognitive behavioral performance after MTX. NORT performance in OPC-TrkB cKO and TrkB WT mice previously exposed to either MTX or PBS vehicle control followed by LM22A-4 or vehicle control, as outlined in F.
Data shown as mean ± SEM; each point = one mouse (B, E, G). ns = p > 0.05, * p < 0.05, ** p < 0.01 *** p<0.001 as determined by two-way ANOVA (B, C, E) or three-way ANOVA (G) with Tukey post-hoc analysis for multiple comparisons. See also Figure S5 and S6