
Fig. 2.
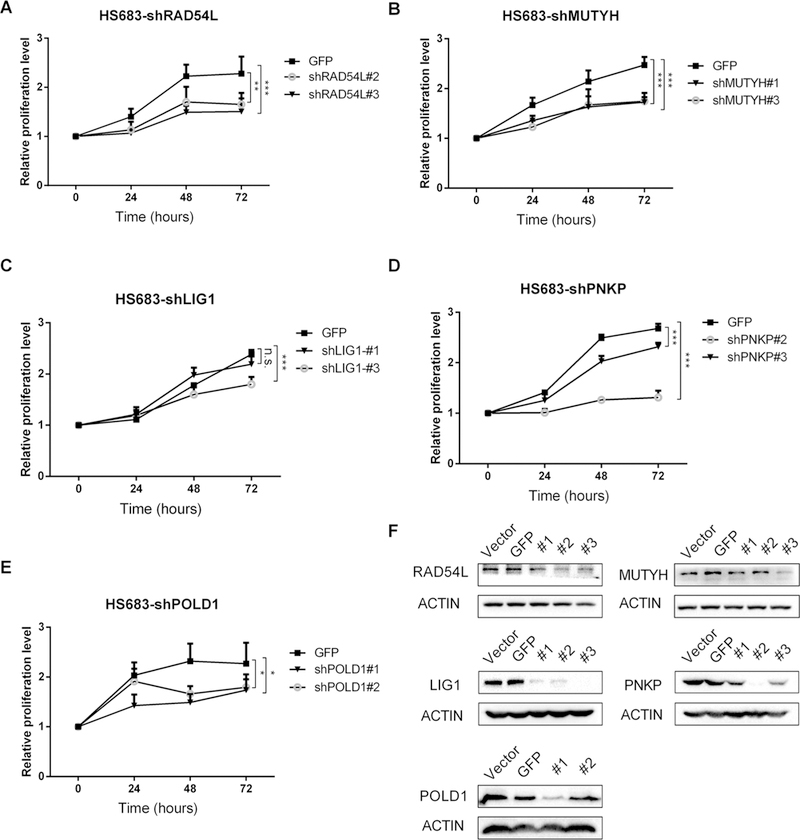
In HS683 cell line: MTS curve at 2 mg/L for: a RAD54L, b MUTYH, c LIG1, d PNKP, e POLD1, and f western blot bands demonstrate good knockdown efficiency. *p < 0.05; **p < 0.01; ***p < 0.001
Official websites use .gov
A
.gov website belongs to an official
government organization in the United States.
Secure .gov websites use HTTPS
A lock (
) or https:// means you've safely
connected to the .gov website. Share sensitive
information only on official, secure websites.
In HS683 cell line: MTS curve at 2 mg/L for: a RAD54L, b MUTYH, c LIG1, d PNKP, e POLD1, and f western blot bands demonstrate good knockdown efficiency. *p < 0.05; **p < 0.01; ***p < 0.001