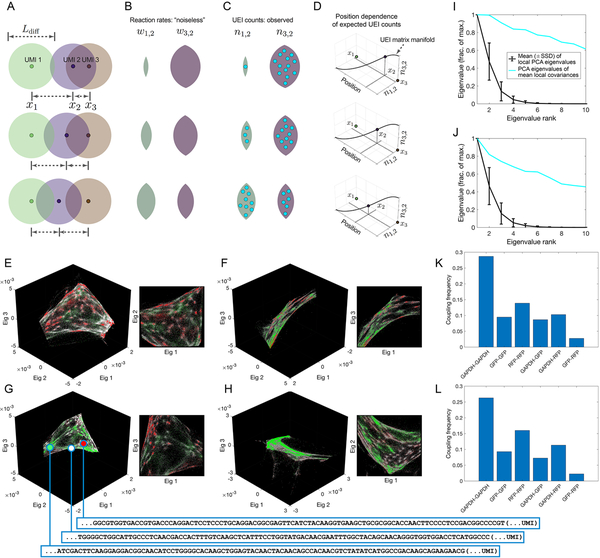
Figure 2. Encoding and decoding molecular localization with DNA microscopy.
(A-D) Expected behavior of UEI counts. Diffusion profiles with length scale Ldiff· belonging to different amplifying UMIs overlap to degrees that depend on the distance between their points of origin (A). Greater overlaps between diffusion profiles result in larger reaction rates (B), which in turn result in higher UEI formation frequencies (C). Because UEI counts are therefore proper functions of position, as a UMI relocates, it sweeps out a curve along the UEI count axes equal to the dimensionality of space it occupies (D). (E–H) Data segmentation permits individual sets of 104 strongly interacting UMIs to be visualized independently. The top three non-trivial eigenvectors for the largest data segments of samples 1 (E–F) and 2 (G–H) are shown, along with a different, magnified view of the same plot. Transcripts are colored by sequence identity: grey = ACTB (beacons), white = GAPDH, green = GFP, red = RFP. (I–J) Quantitative assessment of manifold dimensionality. PCA spectra from local (black) or averaged-local (cyan) covariance matrices formed from the global UEI matrix eigenvector-coordinates of UMIs in samples 1 (I) and 2 (J). Covariance matrices were constructed for each UMI forming UEIs with at least 100 other UMIs, using the first 100 eigenvector coordinates belonging to these associating UMIs alone. (K–L) Average coupling frequencies for each beacon with different target amplicons in samples 1 (K) and 2 (L). A coupling frequency between amplicon types k and l is defined as the average across all beacon UMIs i of the product PikPil, where . Here, nij is the number of UEIs associating beacon UMI i with target UMI j, and Sik is the set of all target UMIs of amplicon type k associating with beacon UMI i.

