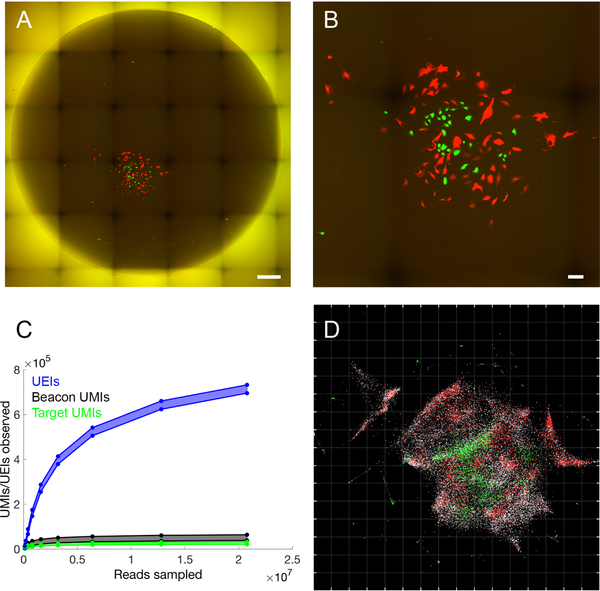
Figure 4. Accurate reconstruction by DNA microscopy of fluorescence microscopy data.
(A,B) Optical imaging of co-cultured cells. (A) Full reaction chamber view of co-cultured GFP- and RFP-expressing cells (scale bar = 500 um). (B) Zoomed view of the same cell population (scale bar = 100 um). (C,D) DNA microscopy of co-cultured cells. (C) Rarefaction of UMIs and UEIs with increasing read-sampling depth. (D) sMLE inference applied to DNA microscopy data, reflected/rotated and rescaled for visual comparison with photograph. Transcripts, sequenced to 98 bp, are colored by sequence identity: grey = ACTB (beacons), white = GAPDH, green = GFP, red = RFP. Grid-line spacings: diffusion length scales (Ldiff), emerging directly from the optimization (STAR Methods).

